Bitcoin(
 BTCUSDT) has shown strong bullish momentum over the past week, climbing nearly +10% and testing key resistance zones. Several fundamental and technical factors fueled this rally.
Key Drivers of the Rise:
ETF inflows – Significant net inflows into spot Bitcoin ETFs boosted demand.
Macro uncertainty – U.S. government shutdown risk and weaker job data supported risk assets.
Monetary policy – Expectations of softer Fed policy improved market sentiment.
Derivatives impact – Options expiry, high OI, and short squeezes added upward pressure.
Exchange outflows – Lower BTC supply on exchanges signaled accumulation.
Positive sentiment – “Uptober” narrative and bullish analyst targets lifted confidence.
-------------------------------------------
Now, if we look at the Bitcoin chart in the above timeframes from a technical analysis perspective, we can see the following:
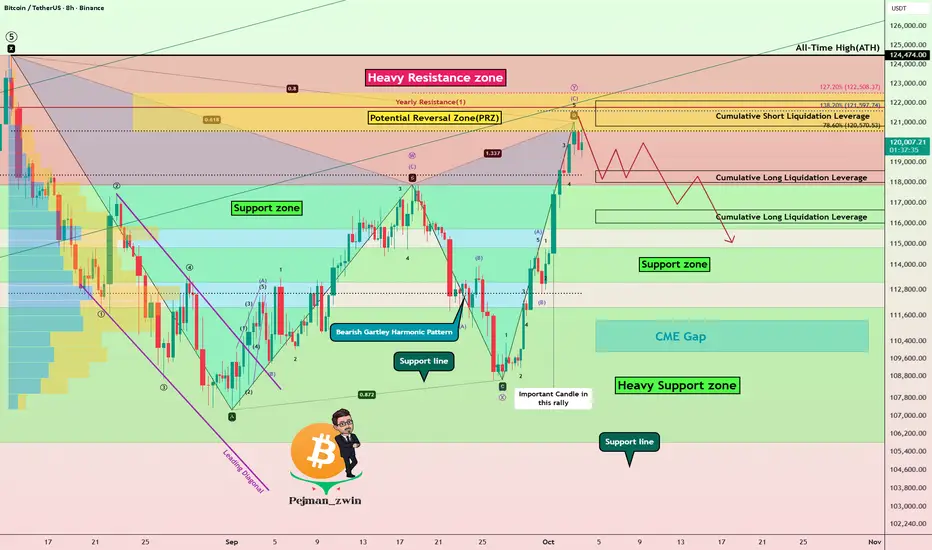
First of all, let me say that the rally that Bitcoin has had over the past 7 days has NOT been accompanied by high volume, and this is not good news for Bitcoin to create a new All-Time High(ATH).
Bitcoin is entering a Heavy Resistance zone($124,474(ATH)-$117,900) and is moving near the Potential Reversal Zone (PRZ)[$122,520-$120,560] and Cumulative Short Liquidation Leverage($122,120-$120,823).
In terms of Elliott Wave theory, Bitcoin appears to be completing a microwave C of the main wave Y. One of the reasons I saw the waves as corrective, other than the microwaves, was the low volume of Bitcoin in the past 7-day rally.
If we look at the Bitcoin chart from a pattern perspective, the important Bearish Gartley Harmonic Pattern is also well and standardly defined on the chart, such that point D in the PRZ can be completed. The Gartley Harmonic Pattern is the most important pattern among the harmonic patterns.
I DO NOT expect a new ATH formation for Bitcoin in this rally due to the above reasons, and I expect it to at least decline to the Support zone($114,820-$113,180).
Note: Important prices to watch for if Bitcoin reverses (in order of importance of volume): $118,400-$112,700
Note: You should note that these days, Bitcoin has a higher correlation with the SPX500( SPX) index than before, so if there is a sudden movement in Bitcoin, one of the reasons could be a sudden movement in the SPX500.
Educational Tip: The volume of each candle is considered to be the identity and credibility of that candle, and you can find these candles with the help of volume candle charts.
Cumulative Long Liquidation Leverage: $118,583-$118,000
Cumulative Long Liquidation Leverage: $116,652-$116,000
CME Gap: $111,355-$109,915
Stop Loss(SL): $125,00(Worst)
Please respect each other's ideas and express them politely if you agree or disagree.
Bitcoin Analysis (BTCUSDT), 8-hour time frame.
Be sure to follow the updated ideas.
Do not forget to put a Stop loss for your positions (For every position you want to open).
Please follow your strategy and updates; this is just my Idea, and I will gladly see your ideas in this post.
Please do not forget the ✅' like'✅ button 🙏😊 & Share it with your friends; thanks, and Trade safe.
Key Drivers of the Rise:
ETF inflows – Significant net inflows into spot Bitcoin ETFs boosted demand.
Macro uncertainty – U.S. government shutdown risk and weaker job data supported risk assets.
Monetary policy – Expectations of softer Fed policy improved market sentiment.
Derivatives impact – Options expiry, high OI, and short squeezes added upward pressure.
Exchange outflows – Lower BTC supply on exchanges signaled accumulation.
Positive sentiment – “Uptober” narrative and bullish analyst targets lifted confidence.
-------------------------------------------
Now, if we look at the Bitcoin chart in the above timeframes from a technical analysis perspective, we can see the following:
First of all, let me say that the rally that Bitcoin has had over the past 7 days has NOT been accompanied by high volume, and this is not good news for Bitcoin to create a new All-Time High(ATH).
Bitcoin is entering a Heavy Resistance zone($124,474(ATH)-$117,900) and is moving near the Potential Reversal Zone (PRZ)[$122,520-$120,560] and Cumulative Short Liquidation Leverage($122,120-$120,823).
In terms of Elliott Wave theory, Bitcoin appears to be completing a microwave C of the main wave Y. One of the reasons I saw the waves as corrective, other than the microwaves, was the low volume of Bitcoin in the past 7-day rally.
If we look at the Bitcoin chart from a pattern perspective, the important Bearish Gartley Harmonic Pattern is also well and standardly defined on the chart, such that point D in the PRZ can be completed. The Gartley Harmonic Pattern is the most important pattern among the harmonic patterns.
I DO NOT expect a new ATH formation for Bitcoin in this rally due to the above reasons, and I expect it to at least decline to the Support zone($114,820-$113,180).
Note: Important prices to watch for if Bitcoin reverses (in order of importance of volume): $118,400-$112,700
Note: You should note that these days, Bitcoin has a higher correlation with the SPX500(
Educational Tip: The volume of each candle is considered to be the identity and credibility of that candle, and you can find these candles with the help of volume candle charts.
Cumulative Long Liquidation Leverage: $118,583-$118,000
Cumulative Long Liquidation Leverage: $116,652-$116,000
CME Gap: $111,355-$109,915
Stop Loss(SL): $125,00(Worst)
Please respect each other's ideas and express them politely if you agree or disagree.
Bitcoin Analysis (BTCUSDT), 8-hour time frame.
Be sure to follow the updated ideas.
Do not forget to put a Stop loss for your positions (For every position you want to open).
Please follow your strategy and updates; this is just my Idea, and I will gladly see your ideas in this post.
Please do not forget the ✅' like'✅ button 🙏😊 & Share it with your friends; thanks, and Trade safe.
Trade attivo
Bitcoin ignored almost all resistance zones during the past week’s rally.
Interestingly, despite the strong upward move, the overall trading volume remained relatively low throughout this 7-day bullish run.
From a technical perspective, Bitcoin started rising from the recent top at $108,353 with a noticeable divergence(RD-), and it remains to be seen how far this momentum can extend in the coming days.
One of the positive drivers behind this rally has been the significant inflow into Bitcoin ETFs at the beginning of October, which clearly added strength to the bullish sentiment.
Another key point worth mentioning is that Bitcoin printed a new all-time high during a weekend session, which could highlight the influence of market makers in driving price action during low-liquidity periods.
Still, taking long positions near the ATH or strong resistance zones is not a rational approach.
If you were already in a long position and managed to take profits — congratulations!
But remember, it doesn’t always work like that, so always apply strict risk management.
A market that rallies without any meaningful correction is a risky market.
Don’t assume the trend will continue endlessly — risk management should always be your top priority.
Another important observation: there’s around $19 billion in liquidation volume sitting below current prices for long positions, compared to just $2 billion for shorts — a very interesting imbalance to monitor.
Finally, let’s all respect each other’s opinions.
Trading is like a long rally — don’t get overconfident after one or two wins, and don’t get discouraged after a few losses.
Keep focusing on risk management and trading psychology — those are the keys to long-term success.
New Potential Reversal Zone (PRZ)[$128,000-$125,000]
New Cumulative Short Liquidation Leverage: $127,000-$126,012
New Cumulative Long Liquidation Leverage: $121,449-$120,559
New Cumulative Long Liquidation Leverage: $118,540-$118,035
Trade chiuso: obiettivo raggiunto
The Potential Reversal Zone (PRZ)[$128,000-$125,000] and Cumulative Short Liquidation Leverage($127,000-$126,012) are performing well.
🎁Get a 20% Discount on your trading FEE on BYBIT:👉partner.bybit.com/b/PEJMANZWIN
🎁Get a 20% Bonus & 30% Discount on LBANK exchange(NO KYC)👉lbank.one/join/uBythQd
🎁Get a 20% Bonus & 30% Discount on LBANK exchange(NO KYC)👉lbank.one/join/uBythQd
Pubblicazioni correlate
Declinazione di responsabilità
Le informazioni ed i contenuti pubblicati non costituiscono in alcun modo una sollecitazione ad investire o ad operare nei mercati finanziari. Non sono inoltre fornite o supportate da TradingView. Maggiori dettagli nelle Condizioni d'uso.