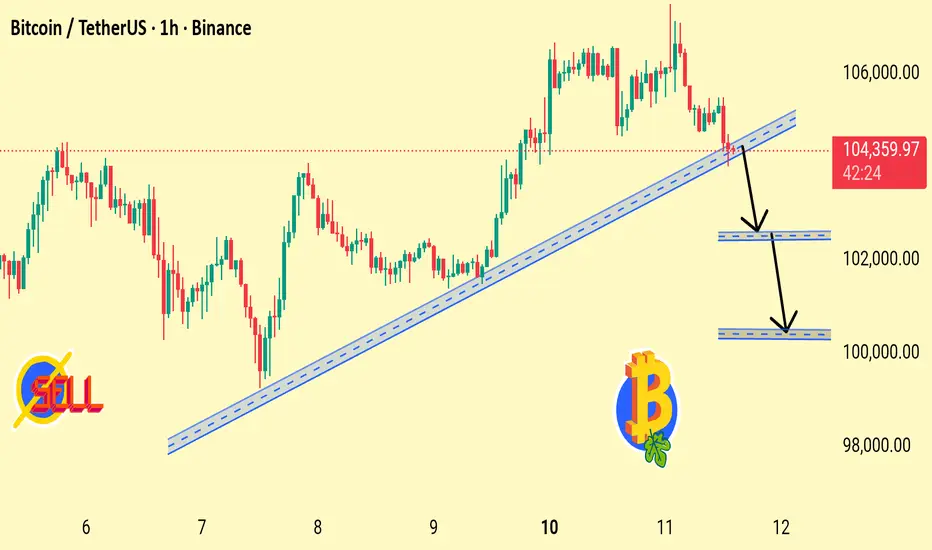
BTC has broken below the rising trendline, signaling weakening bullish momentum. Price may retest $102,500 and potentially dip toward the $100,000 support zone if sellers continue to dominate.
1. Trendline Break Detected
BTC has fallen below the rising trendline that supported the uptrend from Nov 7–11. This signals weakening bullish structure.
2. Momentum Turning Bearish
The rejection near 105,000 and sharp drop indicate sellers are stepping in aggressively.
3. First Support Zone: $102,500
Chart shows the first demand zone here. If BTC stabilizes above this level, a bounce is possible — but weakness still remains.
4. Second Support Zone: $100,000
A deeper drop could test the psychological round number. Strong liquidity is expected at this level.
5. Trend Structure Changing
Breaking the trendline + lower highs = possible shift from bullish to short-term bearish trend.
Trade attivo
Trade active Arrows: Indicate projected downward targets, with the first target zone around $103,100 and the second near $100,000Trade chiuso: obiettivo raggiunto
🎯 Target reached — mission accomplished!Join free telegram channel
t.me/+UlkzSENzAv4wOTc0
Daily 3-5 signals
Xauusd Gold updates
Free signal telegram channel
t.me/+pA0kQEvdgQ9hMWM0
t.me/+UlkzSENzAv4wOTc0
Daily 3-5 signals
Xauusd Gold updates
Free signal telegram channel
t.me/+pA0kQEvdgQ9hMWM0
Pubblicazioni correlate
Declinazione di responsabilità
Le informazioni e le pubblicazioni non sono intese come, e non costituiscono, consulenza o raccomandazioni finanziarie, di investimento, di trading o di altro tipo fornite o approvate da TradingView. Per ulteriori informazioni, consultare i Termini di utilizzo.
Join free telegram channel
t.me/+UlkzSENzAv4wOTc0
Daily 3-5 signals
Xauusd Gold updates
Free signal telegram channel
t.me/+pA0kQEvdgQ9hMWM0
t.me/+UlkzSENzAv4wOTc0
Daily 3-5 signals
Xauusd Gold updates
Free signal telegram channel
t.me/+pA0kQEvdgQ9hMWM0
Pubblicazioni correlate
Declinazione di responsabilità
Le informazioni e le pubblicazioni non sono intese come, e non costituiscono, consulenza o raccomandazioni finanziarie, di investimento, di trading o di altro tipo fornite o approvate da TradingView. Per ulteriori informazioni, consultare i Termini di utilizzo.