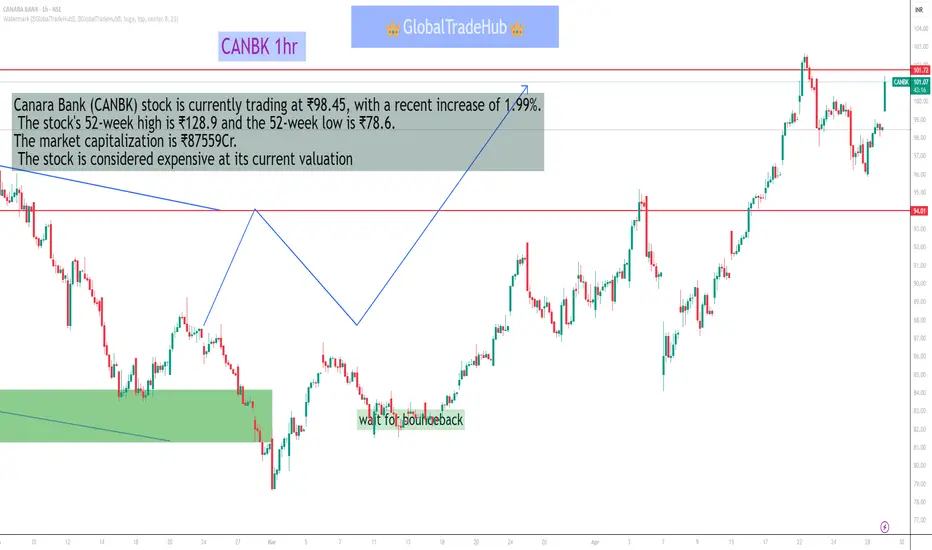
As of April 29, 2025, here are the key 1-hour support and resistance levels for Canara Bank (NSE: CANBK) based on recent technical analyses:
📈 1-Hour Support and Resistance Levels
Type Level (₹)
Resistance 1 (R1) ₹108.05
Resistance 2 (R2) ₹109.51
Support 1 (S1) ₹104.56
Support 2 (S2) ₹102.53
These levels are derived from recent intraday price action and can serve as potential reversal or breakout zones for the stock.
📊 Additional Technical Indicators
Relative Strength Index (RSI): Approximately 60, indicating a neutral to slightly bullish momentum.
Moving Average Convergence Divergence (MACD): Currently in a bearish crossover, suggesting potential downward pressure.
Bollinger Bands: The stock is trading near the upper band, indicating high volatility and potential overbought conditions.
📌 Key Observations
Resistance Levels: If Canara Bank breaks above ₹108.05, it may face resistance at ₹109.51.
Support Levels: A decline below ₹104.56 could lead to further support at ₹102.53.
Trend Analysis: The stock is currently testing the upper resistance zone. A breakout above ₹108.05 could signal a continuation of the upward trend. Conversely, a drop below ₹104.56 may indicate a bearish reversal.
Please note that these levels and indicators are based on historical data and technical analysis, and actual market conditions may vary. It's advisable to conduct further research or consult with a financial advisor before making investment decisions.
Pubblicazioni correlate
Declinazione di responsabilità
Le informazioni ed i contenuti pubblicati non costituiscono in alcun modo una sollecitazione ad investire o ad operare nei mercati finanziari. Non sono inoltre fornite o supportate da TradingView. Maggiori dettagli nelle Condizioni d'uso.
Pubblicazioni correlate
Declinazione di responsabilità
Le informazioni ed i contenuti pubblicati non costituiscono in alcun modo una sollecitazione ad investire o ad operare nei mercati finanziari. Non sono inoltre fornite o supportate da TradingView. Maggiori dettagli nelle Condizioni d'uso.
