🔍 Key Levels
Based on recent technical data:
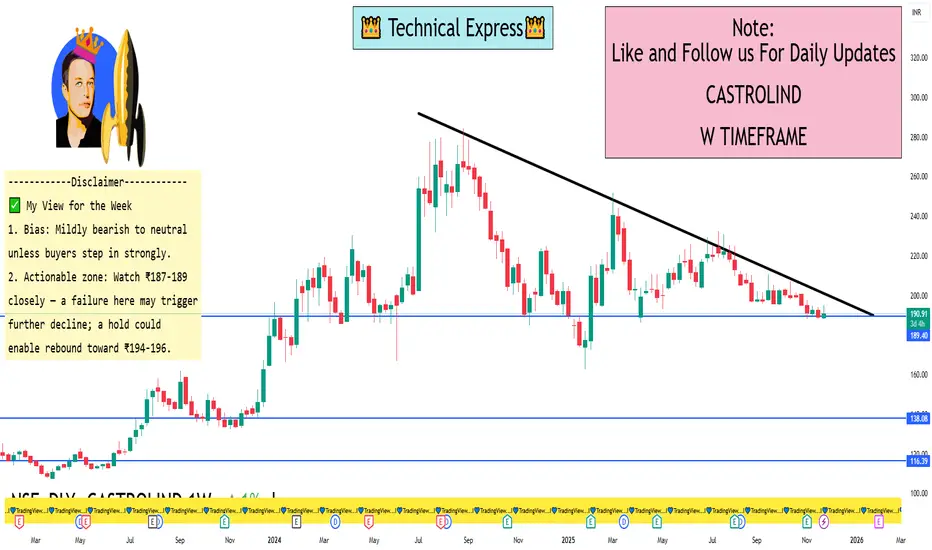
Support zone: ~ ₹187 – ₹189 (ET Money shows S3 ≈ ₹185.42, S2 ≈ ₹186.71)
Pivot / near-term equilibrium: ~ ₹190 – ₹191 (Weekly central pivot ~₹190.42)
Upside resistance: ~ ₹194 - ₹196 (Weekly R1 ~₹192.83, R2 ~₹196.64)
📈 Short-Term Bias & Likely Scenarios
The momentum indicators (RSI ~33, CCI negative) show the stock is under downward pressure/weak momentum.
If the price stays above ₹187-189, one could anticipate a bounce up into the ₹194-196 zone this week.
If it breaks below ~₹187-189 decisively, support further down could be ~₹183-185 (based on extension levels)
✅ My View for the Week
Bias: Mildly bearish to neutral unless buyers step in strongly.
Actionable zone: Watch ₹187-189 closely — a failure here may trigger further decline; a hold could enable rebound toward ₹194-196.
If you want a more aggressive trade setup (with stop-loss, reward ratio), I can map that too.
Based on recent technical data:
Support zone: ~ ₹187 – ₹189 (ET Money shows S3 ≈ ₹185.42, S2 ≈ ₹186.71)
Pivot / near-term equilibrium: ~ ₹190 – ₹191 (Weekly central pivot ~₹190.42)
Upside resistance: ~ ₹194 - ₹196 (Weekly R1 ~₹192.83, R2 ~₹196.64)
📈 Short-Term Bias & Likely Scenarios
The momentum indicators (RSI ~33, CCI negative) show the stock is under downward pressure/weak momentum.
If the price stays above ₹187-189, one could anticipate a bounce up into the ₹194-196 zone this week.
If it breaks below ~₹187-189 decisively, support further down could be ~₹183-185 (based on extension levels)
✅ My View for the Week
Bias: Mildly bearish to neutral unless buyers step in strongly.
Actionable zone: Watch ₹187-189 closely — a failure here may trigger further decline; a hold could enable rebound toward ₹194-196.
If you want a more aggressive trade setup (with stop-loss, reward ratio), I can map that too.
I built a Buy & Sell Signal Indicator with 85% accuracy.
📈 Get access via DM or
WhatsApp: wa.link/d997q0
Contact - +91 76782 40962
| Email: techncialexpress@gmail.com
| Script Coder | Trader | Investor | From India
📈 Get access via DM or
WhatsApp: wa.link/d997q0
Contact - +91 76782 40962
| Email: techncialexpress@gmail.com
| Script Coder | Trader | Investor | From India
Pubblicazioni correlate
Declinazione di responsabilità
Le informazioni e le pubblicazioni non sono intese come, e non costituiscono, consulenza o raccomandazioni finanziarie, di investimento, di trading o di altro tipo fornite o approvate da TradingView. Per ulteriori informazioni, consultare i Termini di utilizzo.