#CHENNPETRO
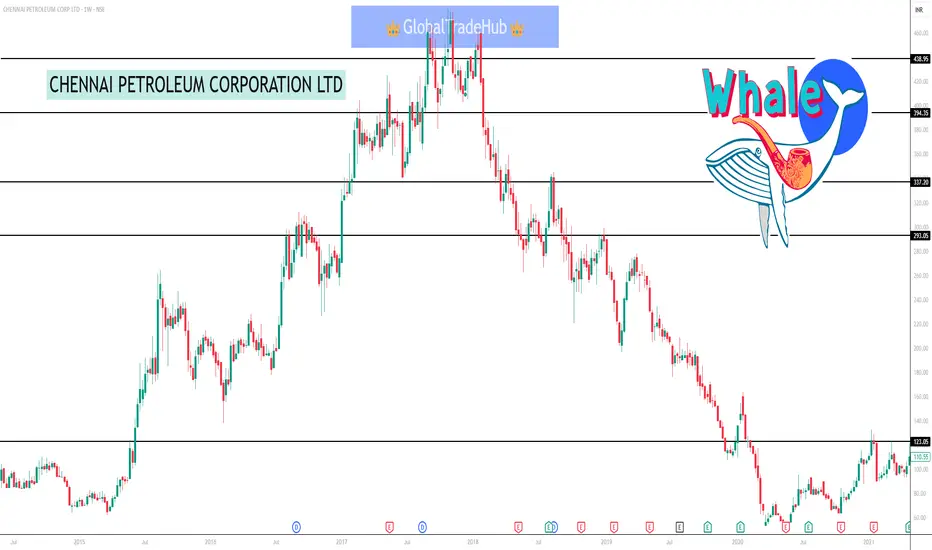
Weekly Time Frame Technical Analysis for Chennai Petroleum (CHENNPETRO) Potential Bullish Scenario:
If the bullish engulfing candle is confirmed with subsequent positive price action, the stock could see an upward move.
A break above the recent high around ₹670-1680 could signal further bullish momentum.
Potential Bearish Scenario:
Failure to sustain above the rising support trendline could lead to further downside.
Strong resistance might be encountered at higher levels, potentially limiting the upside.
Buy & Sell Setup (Weekly Time Frame):
Buy Setup:
Entry: Consider entering in the range of 2530 - ₹570, as suggested by some analysts, especially if there is confirmation of the bullish reversal.
Alternatively, a more conservative entry could be considered on a sustained break above ₹680. Targets:
Target 1: *650 - ₹670 (Short-term)
Target 2: *750 - ₹780 (Medium-term)
Target 3: *850+ (Medium to Long-term)
Stop Loss: Place a stop loss below the recent low or around 433 to manage risk, as suggested by some analyses. A slightly tighter stop loss could be considered based on your risk tolerance, potentially below a key weekly support level.
Sell Setup:
Entry: Consider a short position if the price breaks down decisively below the
rising support trendline, especially
Increased volume.
Targets: Potential targets could be previous support levels, such as ₹500, 450, and the recent low of *433.
Stop Loss: Place a stop loss above the breakdown level or a recent swing high to limit potential losses.
Important Considerations:
Potential Buy Setup Box:
Entry Zone: *580 - ₹635
This zone encompasses the current price action and the recent bullish engulfing candle. Entering within this range assumes the bullish momentum will continue. Target 1: *670 - ₹680 (Previous swing high, potential initial resistance)
Target 2: *750 - ₹780 (Medium-term target based on Fibonacci levels and previous price action)
Stop Loss: Below *530
This level provides a buffer below the recent low and the potential support trendline. A break below this could negate the immediate bullish scenario.
Potential Sell Setup Box:
Entry Zone: *670-2700
This zone represents a potential area of resistance based on the previous swing high. Shorting within this range assumes a failure to break above this level.
Target 1: *635 - *610 (Initial support level)
Target 2: *580 - ₹550 (Further support zone)
Stop Loss: Above *720
This level provides protection against a potential breakout above the resistance zone.
Visual Representation (Conceptual):
Potential Buy Setup:
Entry Zone: *580-2635
Target 1: 2670-680
Target 1: 670 - ₹680 Target 2: *750 - ₹780
Stop Loss: Below *530
Potential Sell Setup:
Entry Zone: *670 - ₹700
Target 1: *635-610
Target 2: 580-2550
Stop Loss: Above *720
This Analysis for only education purpose & learning
Pubblicazioni correlate
Declinazione di responsabilità
Le informazioni ed i contenuti pubblicati non costituiscono in alcun modo una sollecitazione ad investire o ad operare nei mercati finanziari. Non sono inoltre fornite o supportate da TradingView. Maggiori dettagli nelle Condizioni d'uso.
Pubblicazioni correlate
Declinazione di responsabilità
Le informazioni ed i contenuti pubblicati non costituiscono in alcun modo una sollecitazione ad investire o ad operare nei mercati finanziari. Non sono inoltre fornite o supportate da TradingView. Maggiori dettagli nelle Condizioni d'uso.