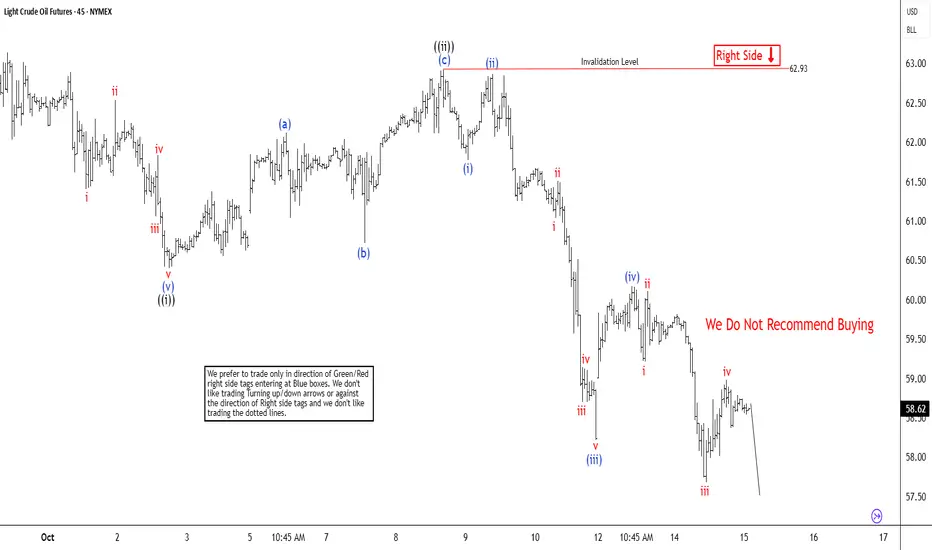
The short-term Elliott Wave analysis for oil indicates that a decline from the September 26, 2025, high is unfolding as a five-wave impulse. Starting from that peak, wave ((i)) concluded at $60.40, as depicted on the 45-minute chart. Subsequently, wave ((ii)) rallied in a zigzag Elliott Wave pattern. From the low of wave ((i)), wave (a) reached $62.12, followed by a pullback in wave (b) to $60.72. The upward move in wave (c) peaked at $62.93, completing wave ((ii)) at a higher degree.
Oil then continued its descent in wave ((iii)), structured as an impulsive sequence. From the wave ((ii)) high, wave (i) dropped to $61.78, and wave (ii) corrected to $62.87. Wave (iii) extended lower to $58.22, with a bounce in wave (iv) reaching $60.17. In the near term, as long as the pivot at $62.93 holds, any rally is expected to falter in a 3, 7, or 11-swing pattern, leading to further declines. The potential downside target lies between $53.2 and $56.9, based on the 100% to 161.8% Fibonacci extension of wave ((i)). This analysis suggests continued bearish momentum, with limited upside potential unless the key pivot is breached.
Oil then continued its descent in wave ((iii)), structured as an impulsive sequence. From the wave ((ii)) high, wave (i) dropped to $61.78, and wave (ii) corrected to $62.87. Wave (iii) extended lower to $58.22, with a bounce in wave (iv) reaching $60.17. In the near term, as long as the pivot at $62.93 holds, any rally is expected to falter in a 3, 7, or 11-swing pattern, leading to further declines. The potential downside target lies between $53.2 and $56.9, based on the 100% to 161.8% Fibonacci extension of wave ((i)). This analysis suggests continued bearish momentum, with limited upside potential unless the key pivot is breached.
14 days trial --> elliottwave-forecast.com/plan-trial/ and get Accurate & timely Elliott Wave Forecasts of 78 instruments. Webinars, Chat Room, Stocks/Forex/Indices Signals & more.
Declinazione di responsabilità
Le informazioni ed i contenuti pubblicati non costituiscono in alcun modo una sollecitazione ad investire o ad operare nei mercati finanziari. Non sono inoltre fornite o supportate da TradingView. Maggiori dettagli nelle Condizioni d'uso.