Key Observations
Channel Pattern & Elliott Wave Count:
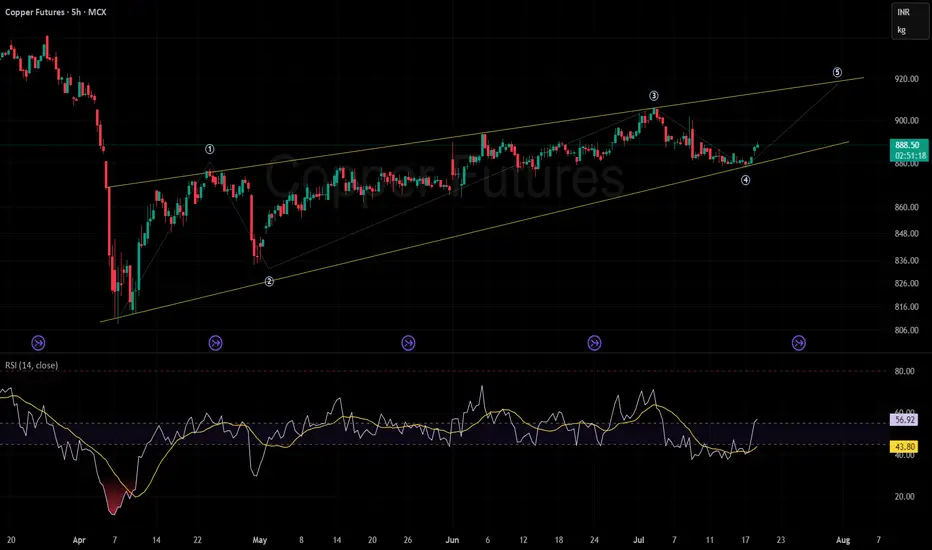
Price action is moving within a well-defined upward-sloping channel (yellow lines).
An Elliott Wave structure is marked (① to ⑤). The price just completed wave ④, suggesting the next move may attempt to form wave ⑤ towards the upper channel boundary, targeting roughly the 920 level.
Price Support & Resistance:
Support: The lower channel boundary, recently tested during the wave ④ dip (~880 area), acts as a dynamic support.
Resistance: The upper channel line, which coincides with the projected wave ⑤, serves as resistance near 920.
RSI & Momentum:
The Relative Strength Index (RSI) at the bottom oscillates between 43.81 (current), with a recent bounce upward.
The yellow MA of RSI is at 57.07, showing the RSI is crossing its MA from below, which is typically a bullish signal.
RSI is neither overbought nor oversold, offering room for upward movement if momentum sustains.
Trend Context:
The overall trend is upward within the channel.
Recent price action after the wave ④ low suggests a renewed attempt at bullish momentum.
Summary & Implications:
The chart implies a bullish bias as long as the lower channel (support) holds. There is a technical setup for a move toward the upper trendline and wave ⑤ target (~920).
Watch for price reactions near the lower channel support—if broken, it would invalidate the immediate bullish thesis.
RSI is supportive of further upside, but needs confirmation from increasing volume and a sustained move above the 890 mark.
Channel Pattern & Elliott Wave Count:
Price action is moving within a well-defined upward-sloping channel (yellow lines).
An Elliott Wave structure is marked (① to ⑤). The price just completed wave ④, suggesting the next move may attempt to form wave ⑤ towards the upper channel boundary, targeting roughly the 920 level.
Price Support & Resistance:
Support: The lower channel boundary, recently tested during the wave ④ dip (~880 area), acts as a dynamic support.
Resistance: The upper channel line, which coincides with the projected wave ⑤, serves as resistance near 920.
RSI & Momentum:
The Relative Strength Index (RSI) at the bottom oscillates between 43.81 (current), with a recent bounce upward.
The yellow MA of RSI is at 57.07, showing the RSI is crossing its MA from below, which is typically a bullish signal.
RSI is neither overbought nor oversold, offering room for upward movement if momentum sustains.
Trend Context:
The overall trend is upward within the channel.
Recent price action after the wave ④ low suggests a renewed attempt at bullish momentum.
Summary & Implications:
The chart implies a bullish bias as long as the lower channel (support) holds. There is a technical setup for a move toward the upper trendline and wave ⑤ target (~920).
Watch for price reactions near the lower channel support—if broken, it would invalidate the immediate bullish thesis.
RSI is supportive of further upside, but needs confirmation from increasing volume and a sustained move above the 890 mark.
Declinazione di responsabilità
Le informazioni ed i contenuti pubblicati non costituiscono in alcun modo una sollecitazione ad investire o ad operare nei mercati finanziari. Non sono inoltre fornite o supportate da TradingView. Maggiori dettagli nelle Condizioni d'uso.
Declinazione di responsabilità
Le informazioni ed i contenuti pubblicati non costituiscono in alcun modo una sollecitazione ad investire o ad operare nei mercati finanziari. Non sono inoltre fornite o supportate da TradingView. Maggiori dettagli nelle Condizioni d'uso.