CoreWeave – Possible Head & Shoulders Breakdown
📊 Overview
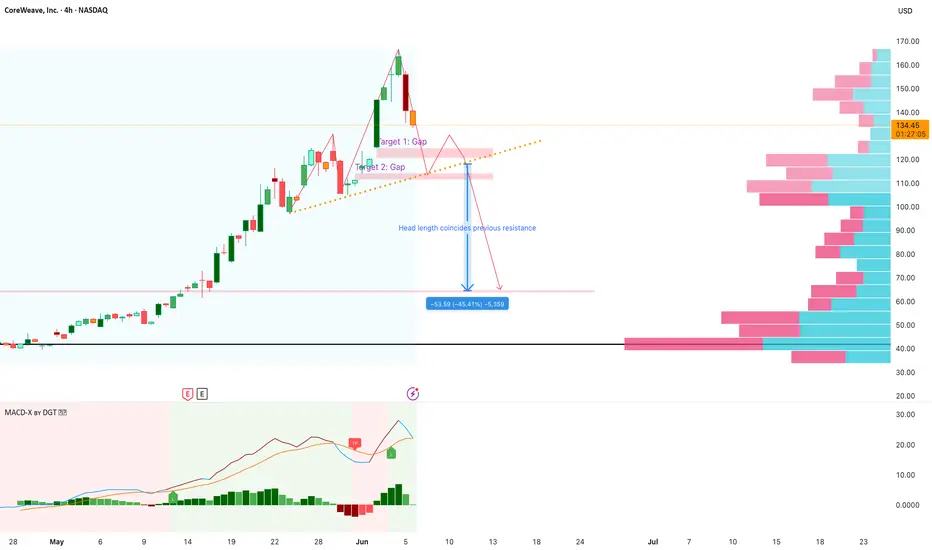
- The stock is currently trading at $138.04, after a sharp drop of -15.37% today.
- A potential Head and Shoulders pattern is forming, suggesting a bearish reversal after a parabolic uptrend.
🔍 Chart Patterns & Key Levels
🟥 Head and Shoulders Formation
- The head appears to be forming now.
- The potential head height suggests a potential downside of ~45%, which aligns with a previous resistance zone near $70–75.
- If confirmed, this pattern could lead to a full retracement to this level.
📉 Gap Targets (Short-term)
- Target 1: There is a gap-fill level around $125–128 (highlighted in light pink).
- Target 2: Another gap support zone exists around $110–112.
📐 Trendline Support
- A dashed orange trendline (upward-sloping) may offer temporary support.
- If this is broken, selling pressure could intensify.
📊 MACD (Momentum Indicator)
- MACD lines are elevated but appear to be turning, indicating that momentum may be exhausted.
- No bearish crossover yet, but watch for one as a signal of further weakness.
💸 Average Cost
- Most transactions executed at 40$. Good for those realizing current rally.
⚠️ Strategy & Risk
- A break below $130 could trigger a deeper correction toward the gap levels.
- If the head-and-shoulders neckline breaks, expect a move toward $70s, which represents a -45% retracement from the top.
- Monitor volume and MACD crossover for confirmation of a breakdown.
- Consider using tight stop-losses above the right shoulder if trading short.
📊 Overview
- The stock is currently trading at $138.04, after a sharp drop of -15.37% today.
- A potential Head and Shoulders pattern is forming, suggesting a bearish reversal after a parabolic uptrend.
🔍 Chart Patterns & Key Levels
🟥 Head and Shoulders Formation
- The head appears to be forming now.
- The potential head height suggests a potential downside of ~45%, which aligns with a previous resistance zone near $70–75.
- If confirmed, this pattern could lead to a full retracement to this level.
📉 Gap Targets (Short-term)
- Target 1: There is a gap-fill level around $125–128 (highlighted in light pink).
- Target 2: Another gap support zone exists around $110–112.
📐 Trendline Support
- A dashed orange trendline (upward-sloping) may offer temporary support.
- If this is broken, selling pressure could intensify.
📊 MACD (Momentum Indicator)
- MACD lines are elevated but appear to be turning, indicating that momentum may be exhausted.
- No bearish crossover yet, but watch for one as a signal of further weakness.
💸 Average Cost
- Most transactions executed at 40$. Good for those realizing current rally.
⚠️ Strategy & Risk
- A break below $130 could trigger a deeper correction toward the gap levels.
- If the head-and-shoulders neckline breaks, expect a move toward $70s, which represents a -45% retracement from the top.
- Monitor volume and MACD crossover for confirmation of a breakdown.
- Consider using tight stop-losses above the right shoulder if trading short.
Declinazione di responsabilità
Le informazioni e le pubblicazioni non sono intese come, e non costituiscono, consulenza o raccomandazioni finanziarie, di investimento, di trading o di altro tipo fornite o approvate da TradingView. Per ulteriori informazioni, consultare i Termini di utilizzo.
Declinazione di responsabilità
Le informazioni e le pubblicazioni non sono intese come, e non costituiscono, consulenza o raccomandazioni finanziarie, di investimento, di trading o di altro tipo fornite o approvate da TradingView. Per ulteriori informazioni, consultare i Termini di utilizzo.