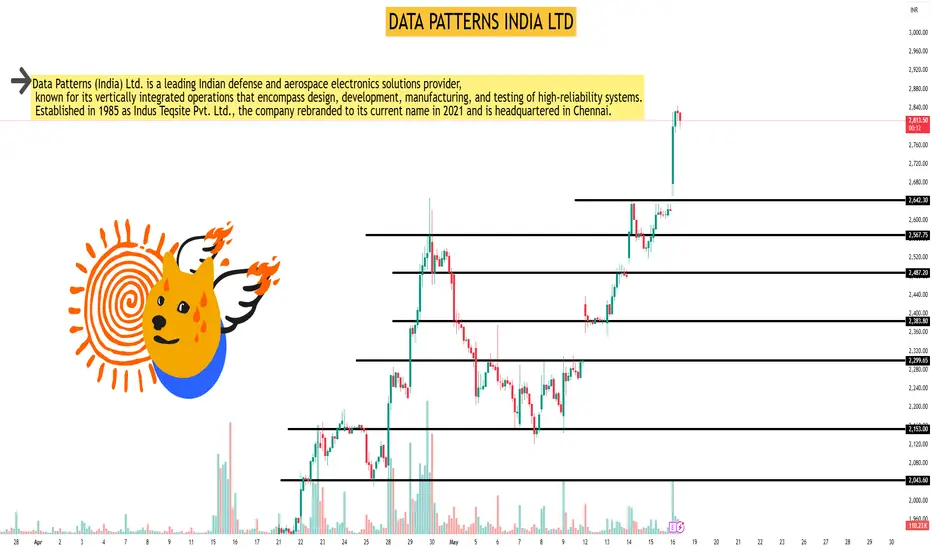
As of May 16, 2025, Data Patterns (India) Ltd. (NSE: DATAPATTNS) exhibits a mildly bullish trend on the 45-minute timeframe, based on key technical indicators.
📊 45-Minute Technical Snapshot
Current Price: ₹2,821.20
20 SMA: ₹1,569.44
50 SMA: ₹1,546.58
Signal: Mild Bullish
Latest Price / MA Crossover: 7 ticks back
Crossover Type: Bullish
Analysis: Mild 20MA up, Mild 50 MA Uptrend, Mild Buy
📈 Additional Technical Indicators
Relative Strength Index (RSI): 72.31
Rate of Change (ROC): 56.07
Average Directional Index (ADX): 25.6
📉 Candlestick Patterns
Bullish Marubozu: Indicates strong buying pressure.
Long White Candle: Suggests bullish momentum.
📌 Summary
The 45-minute technical analysis of Data Patterns (India) Ltd. indicates a mildly bullish trend, supported by moving average crossovers and positive momentum indicators. However, the RSI suggests the stock is approaching overbought territory, warranting cautious optimism.
I built a Buy & Sell Signal Indicator with 85% accuracy.
📈 Get access via DM or
WhatsApp: wa.link/d997q0
Contact - +91 76782 40962
| Email: techncialexpress@gmail.com
| Script Coder | Trader | Investor | From India
📈 Get access via DM or
WhatsApp: wa.link/d997q0
Contact - +91 76782 40962
| Email: techncialexpress@gmail.com
| Script Coder | Trader | Investor | From India
Pubblicazioni correlate
Declinazione di responsabilità
Le informazioni e le pubblicazioni non sono intese come, e non costituiscono, consulenza o raccomandazioni finanziarie, di investimento, di trading o di altro tipo fornite o approvate da TradingView. Per ulteriori informazioni, consultare i Termini di utilizzo.