Detailed Analysis of DOGE/USDT Weekly Chart (Updated)
DOGE/USDT is currently navigating a critical consolidation phase within Wave 4, as per the Elliott Wave framework. Below is a detailed breakdown of its technical structure, including key levels and momentum indicators.
1. Elliott Wave Count
DOGE is in a corrective Wave 4 phase, following a strong impulsive Wave 3, which aligns with the Elliott Wave guidelines:
Wave 1 was the initial impulsive move marking the beginning of the trend.
Wave 2 retraced deeply but respected key Fibonacci retracement levels, establishing a foundation for Wave 3.
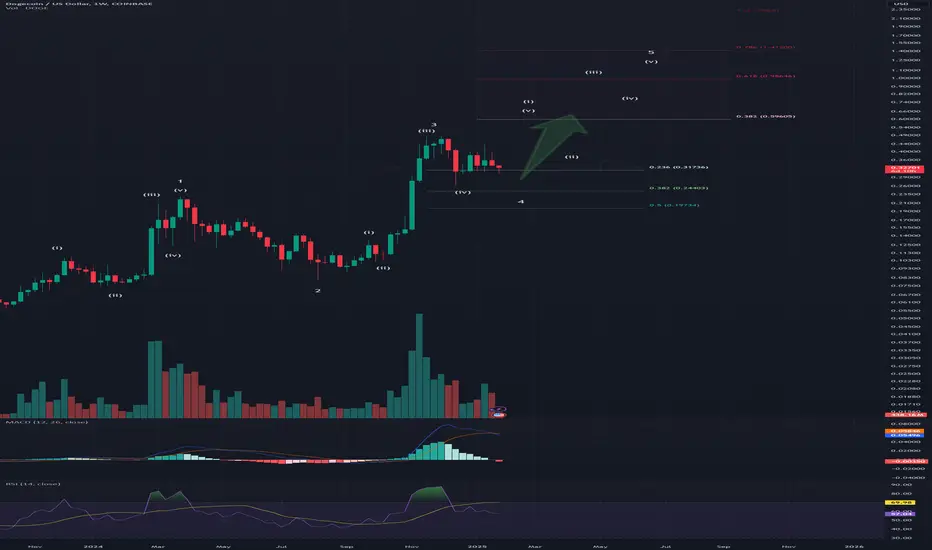
Wave 3 was the most extended and powerful wave, as evidenced by a steep rise in price and volume, peaking near $0.523.
Wave 4:
Currently forming a correction, likely a flat or triangle structure.
Typical of Wave 4, the correction is shallow compared to Wave 2, adhering to the guideline of alternation.
Consolidating within the 23.6%–50% Fibonacci retracement levels of Wave 3.
2. Fibonacci Retracement Levels
Wave 4 correction is respecting Fibonacci retracement levels:
23.6% retracement ($0.31736): Currently acting as a key resistance.
38.2% retracement ($0.24403): A strong support zone for potential reversal and Wave 5 initiation.
50% retracement ($0.19734): A critical level of last-resort support; a breakdown here could invalidate the current Elliott Wave structure.
3. Wave 5 Projection
Upon completion of Wave 4, DOGE is expected to begin its final impulsive Wave 5. Probable targets based on Fibonacci extensions:
0.618 extension ($0.89646): Primary target, aligning with typical Wave 5 behavior.
0.786 extension ($1.412): Secondary target, achievable under strong bullish conditions.
1.0 extension ($2.229): A highly optimistic target, representing significant bullish momentum or speculative fervor.
Wave 5 is likely to retest the previous Wave 3 peak ($0.523) before advancing to higher Fibonacci extension levels.
4. Volume Analysis
Volume behavior reflects the consolidative nature of Wave 4:
Volume has declined since the Wave 3 peak, indicating reduced market activity—a common characteristic of corrective waves.
A volume breakout above the recent average will serve as a confirmation of the transition from Wave 4 to Wave 5.
5. MACD Indicator
The MACD histogram remains in the negative zone but shows signs of shrinking, indicating that bearish momentum is weakening.
The MACD lines are approaching a potential bullish crossover:
A crossover above the signal line will confirm the start of bullish momentum for Wave 5.
6. RSI (Relative Strength Index)
The RSI is currently at 56.79, within the neutral-to-bullish zone:
This indicates a lack of extreme momentum but leaves room for further acceleration.
A breakout above 70 during Wave 5 would confirm strong bullish momentum.
7. Key Levels to Watch
Support Levels:
$0.31736 (23.6% Fibonacci retracement): Current resistance; a breakout above this level signals strength.
$0.24403 (38.2% Fibonacci retracement): A strong support level where Wave 4 could end.
$0.19734 (50% Fibonacci retracement): Last-resort support; breaking below this invalidates the wave structure.
Resistance Levels:
$0.523 (Wave 3 peak): The first key resistance to break for Wave 5 confirmation.
$0.89646 (0.618 extension): Primary target for Wave 5.
$1.412 (0.786 extension): Secondary target, indicating extended bullish momentum.
8. Risk and Invalidations
Break Below $0.24403: Suggests deeper retracement toward $0.19734.
Break Below $0.19734: Invalidates the current Elliott Wave structure, signaling potential further downside.
Broader Market Sentiment: DOGE's movement will likely be influenced by the overall cryptocurrency market sentiment, making external factors (e.g., BTC dominance, macroeconomic conditions) crucial to monitor.
9. Confluence Factors for Wave 5 Confirmation
A breakout above $0.31736 with high volume.
A bullish MACD crossover above the signal line.
RSI moving into the 70+ zone, signaling strong upward momentum.
Conclusion
DOGE/USDT is currently consolidating within a Wave 4 corrective phase, hovering around key Fibonacci retracement levels. If the price respects the $0.24403 support and breaks above $0.31736, it is likely to enter Wave 5, targeting $0.89646 (0.618 extension), with stretch targets at $1.412 (0.786 extension). Risk lies in a break below $0.19734, which would invalidate the wave structure.
Let me know if you’d like further analysis or adjustments!
DOGE/USDT is currently navigating a critical consolidation phase within Wave 4, as per the Elliott Wave framework. Below is a detailed breakdown of its technical structure, including key levels and momentum indicators.
1. Elliott Wave Count
DOGE is in a corrective Wave 4 phase, following a strong impulsive Wave 3, which aligns with the Elliott Wave guidelines:
Wave 1 was the initial impulsive move marking the beginning of the trend.
Wave 2 retraced deeply but respected key Fibonacci retracement levels, establishing a foundation for Wave 3.
Wave 3 was the most extended and powerful wave, as evidenced by a steep rise in price and volume, peaking near $0.523.
Wave 4:
Currently forming a correction, likely a flat or triangle structure.
Typical of Wave 4, the correction is shallow compared to Wave 2, adhering to the guideline of alternation.
Consolidating within the 23.6%–50% Fibonacci retracement levels of Wave 3.
2. Fibonacci Retracement Levels
Wave 4 correction is respecting Fibonacci retracement levels:
23.6% retracement ($0.31736): Currently acting as a key resistance.
38.2% retracement ($0.24403): A strong support zone for potential reversal and Wave 5 initiation.
50% retracement ($0.19734): A critical level of last-resort support; a breakdown here could invalidate the current Elliott Wave structure.
3. Wave 5 Projection
Upon completion of Wave 4, DOGE is expected to begin its final impulsive Wave 5. Probable targets based on Fibonacci extensions:
0.618 extension ($0.89646): Primary target, aligning with typical Wave 5 behavior.
0.786 extension ($1.412): Secondary target, achievable under strong bullish conditions.
1.0 extension ($2.229): A highly optimistic target, representing significant bullish momentum or speculative fervor.
Wave 5 is likely to retest the previous Wave 3 peak ($0.523) before advancing to higher Fibonacci extension levels.
4. Volume Analysis
Volume behavior reflects the consolidative nature of Wave 4:
Volume has declined since the Wave 3 peak, indicating reduced market activity—a common characteristic of corrective waves.
A volume breakout above the recent average will serve as a confirmation of the transition from Wave 4 to Wave 5.
5. MACD Indicator
The MACD histogram remains in the negative zone but shows signs of shrinking, indicating that bearish momentum is weakening.
The MACD lines are approaching a potential bullish crossover:
A crossover above the signal line will confirm the start of bullish momentum for Wave 5.
6. RSI (Relative Strength Index)
The RSI is currently at 56.79, within the neutral-to-bullish zone:
This indicates a lack of extreme momentum but leaves room for further acceleration.
A breakout above 70 during Wave 5 would confirm strong bullish momentum.
7. Key Levels to Watch
Support Levels:
$0.31736 (23.6% Fibonacci retracement): Current resistance; a breakout above this level signals strength.
$0.24403 (38.2% Fibonacci retracement): A strong support level where Wave 4 could end.
$0.19734 (50% Fibonacci retracement): Last-resort support; breaking below this invalidates the wave structure.
Resistance Levels:
$0.523 (Wave 3 peak): The first key resistance to break for Wave 5 confirmation.
$0.89646 (0.618 extension): Primary target for Wave 5.
$1.412 (0.786 extension): Secondary target, indicating extended bullish momentum.
8. Risk and Invalidations
Break Below $0.24403: Suggests deeper retracement toward $0.19734.
Break Below $0.19734: Invalidates the current Elliott Wave structure, signaling potential further downside.
Broader Market Sentiment: DOGE's movement will likely be influenced by the overall cryptocurrency market sentiment, making external factors (e.g., BTC dominance, macroeconomic conditions) crucial to monitor.
9. Confluence Factors for Wave 5 Confirmation
A breakout above $0.31736 with high volume.
A bullish MACD crossover above the signal line.
RSI moving into the 70+ zone, signaling strong upward momentum.
Conclusion
DOGE/USDT is currently consolidating within a Wave 4 corrective phase, hovering around key Fibonacci retracement levels. If the price respects the $0.24403 support and breaks above $0.31736, it is likely to enter Wave 5, targeting $0.89646 (0.618 extension), with stretch targets at $1.412 (0.786 extension). Risk lies in a break below $0.19734, which would invalidate the wave structure.
Let me know if you’d like further analysis or adjustments!
Declinazione di responsabilità
Le informazioni e le pubblicazioni non sono intese come, e non costituiscono, consulenza o raccomandazioni finanziarie, di investimento, di trading o di altro tipo fornite o approvate da TradingView. Per ulteriori informazioni, consultare i Termini di utilizzo.
Declinazione di responsabilità
Le informazioni e le pubblicazioni non sono intese come, e non costituiscono, consulenza o raccomandazioni finanziarie, di investimento, di trading o di altro tipo fornite o approvate da TradingView. Per ulteriori informazioni, consultare i Termini di utilizzo.