Recently, there has been a lot of discussion about the US dollar losing its status as a reserve currency. If you look at the chart of the USD index, you can see that it has decreased from its peak in 2022 (114.77) to its current level (96.37), which is a drop of around 16% over the past two and a half years.
From a technical perspective, this drop makes sense, as the dollar's popularity had grown before, and it gained more than 62% between the lows of 2008 and the peaks in 2022. It would be difficult to list all the reasons why this increase occurred, but the main question now is whether the US currency will continue to decline or if it has a chance to recover.
Before we answer that, let's first determine which wave the USD index is currently in.
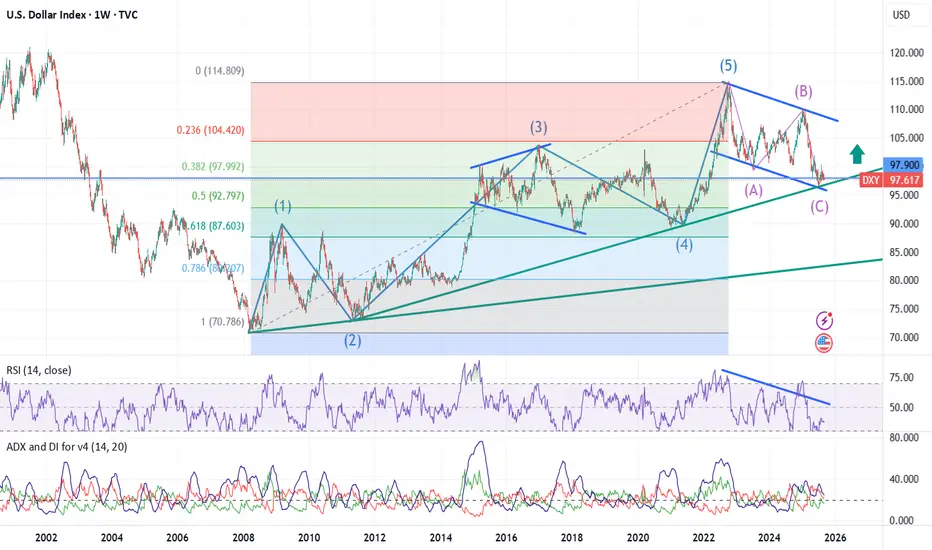
Based on my calculations, the growth cycle began at a level of 70.70 in the year 2008. Wave 1 represented an increase from 70.70 to 89.62 and took approximately two years to form. This wave was followed by Wave 2, which almost fully corrected Wave 1.
Wave 3 went from 72.69 to 103.82 (and, as expected, the third wave beats on five waves of a lesser order), with Wave 3 representing 1.618% of Wave 1.
Wave 4 gave a correction of 50% to the wavelength of Wave 3, in the short term, Wave 4 went beyond the maximum of Wave 1.
But this rule makes sense only for non-marginal markets. Futures markets, with their high margins, can lead to short-term price spikes that would not occur in markets without borrowed funds, so an intersection is allowed, which is usually limited to daily or intraday price changes.
Wave 4 lasted approximately 4.5 years, after which growth was continued by Wave 5. This raised the US dollar index to a level of 114.77, representing 1.272 percent of Wave 1. Therefore, it took approximately 14 years for the entire index to grow.
At the moment, the current growth of 70.70-114.77 has been adjusted by approximately 38.2%, and visually, the ABC structure appears complete. Meanwhile, the US Dollar Index has made a third contact with the support line, which has been in place since April 2011. Based on this, it is likely that we can anticipate some recovery in the position of the US currency.
However, there is an important nuance that could overshadow medium-term predictions for the growth of the dollar. Specifically, it relates to the temporary adjustment parameter. As can be seen within the impulse wave, waves 2 and 4 were quite long in time, and therefore, the entire ABC pattern, in my view, occurred too quickly relative to the overall 14-year growth trend.
And the following conclusions follow from this:
1) Yes, we can expect a rebound from the long-term upward support, and it is even possible that we will see a move in the US Dollar Index to 105-105.5 or 108, but it is unlikely to be higher.
2) However, it is also worth noting that the US dollar is likely to continue its downward trend for the foreseeable future. Because a 2.5-year pullback is clearly not enough to correct a 14-year growth, temporary movements should also be comparable, and the external zigzag may well become a double or triple zigzag and continue the pullback towards the 50-61.8% Fibonacci level to the growth wave of 70.70-114.77. That is, either towards 92.80-93, or towards 87.60.
3) Recently, analysts at deVere Group, one of the world's largest independent financial advisory and asset management organizations, suggested that the US currency will decline by another 10% over the next 12 months. This forecast is supported by similar predictions from other major financial institutions, which foresee a decline in the US currency due to slower growth, aggressive rate cuts and disruptions to global trade.https://www.tradingview.com/chart/KsenHI1w/?symbol=NASDAQ%3ATSLA
From a technical perspective, this drop makes sense, as the dollar's popularity had grown before, and it gained more than 62% between the lows of 2008 and the peaks in 2022. It would be difficult to list all the reasons why this increase occurred, but the main question now is whether the US currency will continue to decline or if it has a chance to recover.
Before we answer that, let's first determine which wave the USD index is currently in.
Based on my calculations, the growth cycle began at a level of 70.70 in the year 2008. Wave 1 represented an increase from 70.70 to 89.62 and took approximately two years to form. This wave was followed by Wave 2, which almost fully corrected Wave 1.
Wave 3 went from 72.69 to 103.82 (and, as expected, the third wave beats on five waves of a lesser order), with Wave 3 representing 1.618% of Wave 1.
Wave 4 gave a correction of 50% to the wavelength of Wave 3, in the short term, Wave 4 went beyond the maximum of Wave 1.
But this rule makes sense only for non-marginal markets. Futures markets, with their high margins, can lead to short-term price spikes that would not occur in markets without borrowed funds, so an intersection is allowed, which is usually limited to daily or intraday price changes.
Wave 4 lasted approximately 4.5 years, after which growth was continued by Wave 5. This raised the US dollar index to a level of 114.77, representing 1.272 percent of Wave 1. Therefore, it took approximately 14 years for the entire index to grow.
At the moment, the current growth of 70.70-114.77 has been adjusted by approximately 38.2%, and visually, the ABC structure appears complete. Meanwhile, the US Dollar Index has made a third contact with the support line, which has been in place since April 2011. Based on this, it is likely that we can anticipate some recovery in the position of the US currency.
However, there is an important nuance that could overshadow medium-term predictions for the growth of the dollar. Specifically, it relates to the temporary adjustment parameter. As can be seen within the impulse wave, waves 2 and 4 were quite long in time, and therefore, the entire ABC pattern, in my view, occurred too quickly relative to the overall 14-year growth trend.
And the following conclusions follow from this:
1) Yes, we can expect a rebound from the long-term upward support, and it is even possible that we will see a move in the US Dollar Index to 105-105.5 or 108, but it is unlikely to be higher.
2) However, it is also worth noting that the US dollar is likely to continue its downward trend for the foreseeable future. Because a 2.5-year pullback is clearly not enough to correct a 14-year growth, temporary movements should also be comparable, and the external zigzag may well become a double or triple zigzag and continue the pullback towards the 50-61.8% Fibonacci level to the growth wave of 70.70-114.77. That is, either towards 92.80-93, or towards 87.60.
3) Recently, analysts at deVere Group, one of the world's largest independent financial advisory and asset management organizations, suggested that the US currency will decline by another 10% over the next 12 months. This forecast is supported by similar predictions from other major financial institutions, which foresee a decline in the US currency due to slower growth, aggressive rate cuts and disruptions to global trade.https://www.tradingview.com/chart/KsenHI1w/?symbol=NASDAQ%3ATSLA
Declinazione di responsabilità
Le informazioni e le pubblicazioni non sono intese come, e non costituiscono, consulenza o raccomandazioni finanziarie, di investimento, di trading o di altro tipo fornite o approvate da TradingView. Per ulteriori informazioni, consultare i Termini di utilizzo.
Declinazione di responsabilità
Le informazioni e le pubblicazioni non sono intese come, e non costituiscono, consulenza o raccomandazioni finanziarie, di investimento, di trading o di altro tipo fornite o approvate da TradingView. Per ulteriori informazioni, consultare i Termini di utilizzo.