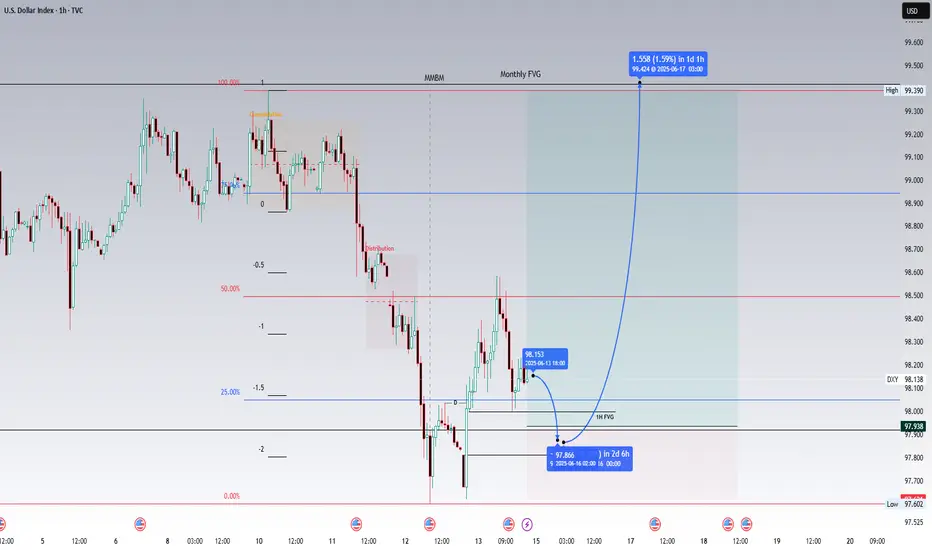
Higher timeframe analysis
Thursday, 12 June 2025 saw the DXY take out the monthly low of 97.921. This poses the bearish monthly FVG as an immediate draw on liquidity at 99.418. Warranting a bullish bias till this level.
Intermediate timeframe analysis
This bullish bias is further confirmed by an initial consolidation identified on the 1H chart immediately below the said monthly FVG. This is a signature of the formation of a market maker buy model. Note the displacement to the updside which occurred at 21:00 EST leaving behind a bullish fair value gap on the 1H. This signals the beginning of the buyside of the curve of a market maker buy model.
Scenario
A potential long scenario could play out whereby price could respect the bullish 1H FVG at 97.999 and reprice updwards towards 99.418. I suspect that the target could be reached by Tuesday morning at 2:00 am - 3:30 am EST, though this is merely an estimation at best. This analysis is largely dependent on the reaction of price in the weekly open. Though in the event of a non-volatile market open this analysis holds decent probability.
Alternate Scenario
Should the above analysis fail the relative equal lows at 97.602 could be taken out before upside to 99.418 is seen.
Nota
The displacement referenced in the Intermediate timeframe analysis occurred on Thursday 21:00 EST.Declinazione di responsabilità
Le informazioni ed i contenuti pubblicati non costituiscono in alcun modo una sollecitazione ad investire o ad operare nei mercati finanziari. Non sono inoltre fornite o supportate da TradingView. Maggiori dettagli nelle Condizioni d'uso.
Declinazione di responsabilità
Le informazioni ed i contenuti pubblicati non costituiscono in alcun modo una sollecitazione ad investire o ad operare nei mercati finanziari. Non sono inoltre fornite o supportate da TradingView. Maggiori dettagli nelle Condizioni d'uso.