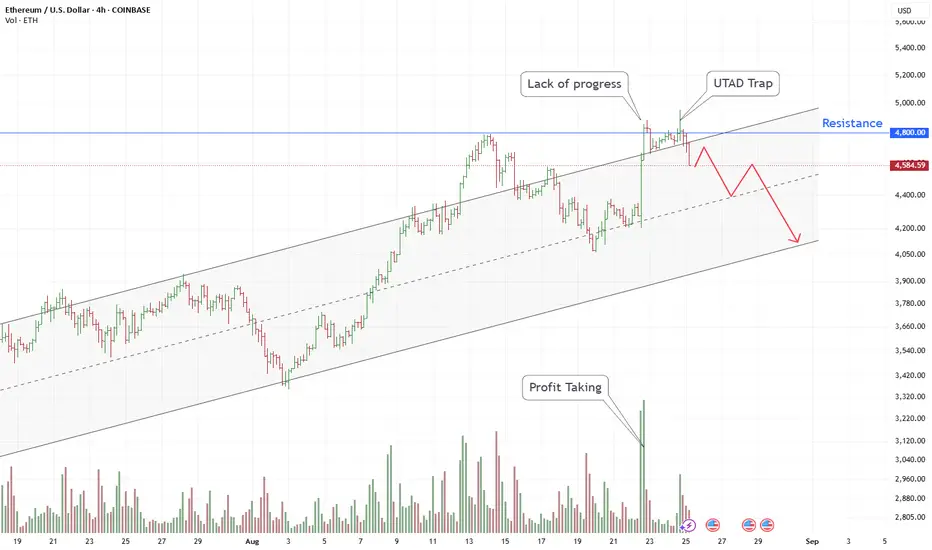
Despite an uptrend since early August that has formed a stable channel, the ETH/USD price has been showing clear signs of weakness in recent days.
The chart shows that the price is struggling to advance above the key resistance level of $4800. This "Lack of progress," combined with a volume spike marked as "Profit Taking," suggests that large players ("smart money") may be selling their assets.
The recent false breakout above $4800 can be interpreted as a "UTAD Trap" (Upthrust After Distribution). Such maneuvers are often used to capture liquidity before initiating a downward phase.
Based on this, the current situation suggests the beginning of a downward correction. A likely target for this move is first the channel's midline around $4,400, after which the price may head towards its lower boundary in the $4,100-$4,200 region.
Supply And Demand Trading .com
Declinazione di responsabilità
Le informazioni ed i contenuti pubblicati non costituiscono in alcun modo una sollecitazione ad investire o ad operare nei mercati finanziari. Non sono inoltre fornite o supportate da TradingView. Maggiori dettagli nelle Condizioni d'uso.