ETHUSD 4H Chart Pattern
📌 Target Zone
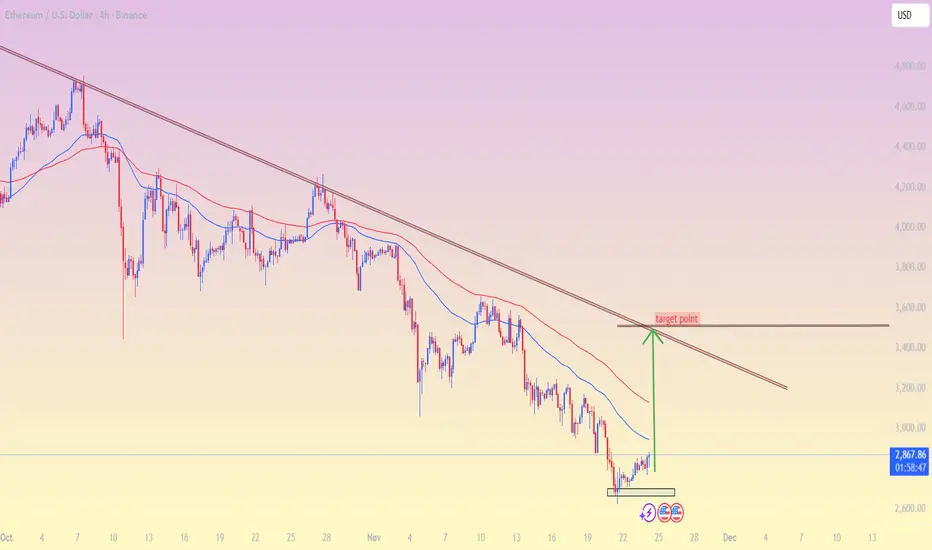
My chart shows price around $2,860 and the trendline resistance sitting roughly around:
➡ Target: $3,450 – $3,550
This zone comes from:
The descending trendline (major resistance)
The level my marked with the green arrow
Previous reaction zone where price last rejected
🔍 Why this target
Price is forming a short-term bottom.
A bounce toward the trendline resistance is reasonable if momentum continues.
That trendline is the next major obstacle for bulls.
⚠ Important
These are technical analysis levels, not financial advice. Always evaluate risk and market conditions.
If my want, I can also give: ✔ Support levels
✔ Breakout target
✔ Stop-loss ideas (educational)
✔ Updated analysis with timeframe my prefer
📌 Target Zone
My chart shows price around $2,860 and the trendline resistance sitting roughly around:
➡ Target: $3,450 – $3,550
This zone comes from:
The descending trendline (major resistance)
The level my marked with the green arrow
Previous reaction zone where price last rejected
🔍 Why this target
Price is forming a short-term bottom.
A bounce toward the trendline resistance is reasonable if momentum continues.
That trendline is the next major obstacle for bulls.
⚠ Important
These are technical analysis levels, not financial advice. Always evaluate risk and market conditions.
If my want, I can also give: ✔ Support levels
✔ Breakout target
✔ Stop-loss ideas (educational)
✔ Updated analysis with timeframe my prefer
Trade attivo
active active 📲 Join telegram channel free ..
t.me/RSI_Trading_Point4
Forex, Gold & Crypto Signals with detailed analysis & get consistent results..
t.me/XauusdGlobalSignal17
Gold Signal's with proper TP & SL for high profit opportunities..
t.me/RSI_Trading_Point4
Forex, Gold & Crypto Signals with detailed analysis & get consistent results..
t.me/XauusdGlobalSignal17
Gold Signal's with proper TP & SL for high profit opportunities..
Pubblicazioni correlate
Declinazione di responsabilità
Le informazioni e le pubblicazioni non sono intese come, e non costituiscono, consulenza o raccomandazioni finanziarie, di investimento, di trading o di altro tipo fornite o approvate da TradingView. Per ulteriori informazioni, consultare i Termini di utilizzo.
📲 Join telegram channel free ..
t.me/RSI_Trading_Point4
Forex, Gold & Crypto Signals with detailed analysis & get consistent results..
t.me/XauusdGlobalSignal17
Gold Signal's with proper TP & SL for high profit opportunities..
t.me/RSI_Trading_Point4
Forex, Gold & Crypto Signals with detailed analysis & get consistent results..
t.me/XauusdGlobalSignal17
Gold Signal's with proper TP & SL for high profit opportunities..
Pubblicazioni correlate
Declinazione di responsabilità
Le informazioni e le pubblicazioni non sono intese come, e non costituiscono, consulenza o raccomandazioni finanziarie, di investimento, di trading o di altro tipo fornite o approvate da TradingView. Per ulteriori informazioni, consultare i Termini di utilizzo.