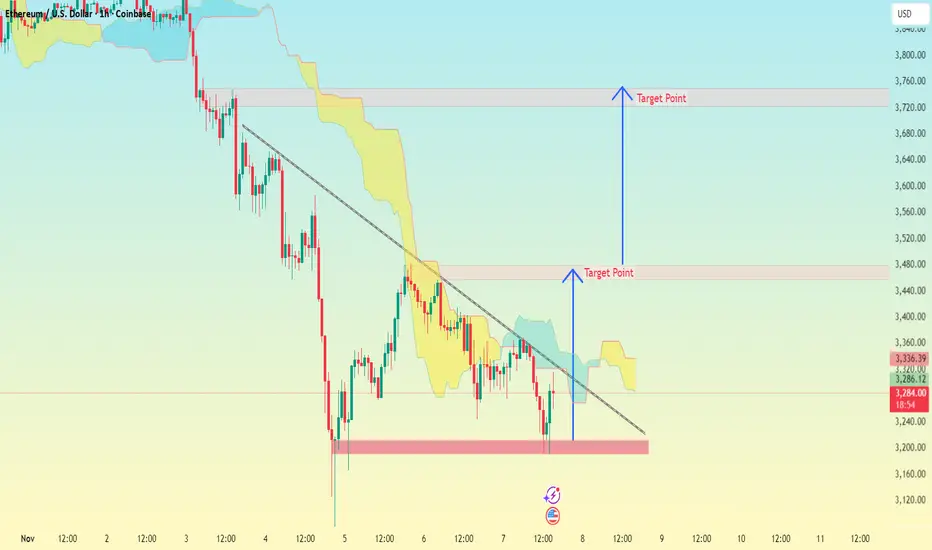
ETH/USD (Ethereum vs U.S. Dollar) on what seems to be the 2-hour timeframe.
Here’s what’s visible:
The chart shows a descending trendline (downtrend) and a horizontal support zone around the $3,200 area.
My marked two “Target Points” above, suggesting a bullish reversal setup from that support.
🎯 Target Levels (approximate based on chart scale)
1. First Target Point: around $3,450 – $3,480
→ This aligns with the first resistance zone and the projected move from the descending breakout.
2. Second Target Point: around $3,720 – $3,750
→ This represents the measured move from the pattern height projected upward — the next major resistance.
---
⚙ Summary
Current Price: ≈ $3,283
Support Zone: ≈ $3,200
1st Target: $3,450
2nd Target: $3,720
Bias: Bullish breakout expected if ETH/USD breaks above the descending trendline and confirms above the Ichimoku cloud.
Trade attivo
active📲 Join telegram channel free .
t.me/addlist/dg3uSwzkMSplNjFk
Forex, Gold & Crypto Signals with detailed analysis & get consistent results.
t.me/addlist/dg3uSwzkMSplNjFk
Gold Signal's with proper TP & SL for high profit opportunities.
t.me/addlist/dg3uSwzkMSplNjFk
Forex, Gold & Crypto Signals with detailed analysis & get consistent results.
t.me/addlist/dg3uSwzkMSplNjFk
Gold Signal's with proper TP & SL for high profit opportunities.
Pubblicazioni correlate
Declinazione di responsabilità
Le informazioni e le pubblicazioni non sono intese come, e non costituiscono, consulenza o raccomandazioni finanziarie, di investimento, di trading o di altro tipo fornite o approvate da TradingView. Per ulteriori informazioni, consultare i Termini di utilizzo.
📲 Join telegram channel free .
t.me/addlist/dg3uSwzkMSplNjFk
Forex, Gold & Crypto Signals with detailed analysis & get consistent results.
t.me/addlist/dg3uSwzkMSplNjFk
Gold Signal's with proper TP & SL for high profit opportunities.
t.me/addlist/dg3uSwzkMSplNjFk
Forex, Gold & Crypto Signals with detailed analysis & get consistent results.
t.me/addlist/dg3uSwzkMSplNjFk
Gold Signal's with proper TP & SL for high profit opportunities.
Pubblicazioni correlate
Declinazione di responsabilità
Le informazioni e le pubblicazioni non sono intese come, e non costituiscono, consulenza o raccomandazioni finanziarie, di investimento, di trading o di altro tipo fornite o approvate da TradingView. Per ulteriori informazioni, consultare i Termini di utilizzo.