ETH/USDT – Symmetrical Diametric in Progress (4H Analysis)
Here’s a TradingView post designed for your ETH/USDT 4H chart analysis using NeoWave – Symmetrical Diametric structure:
---
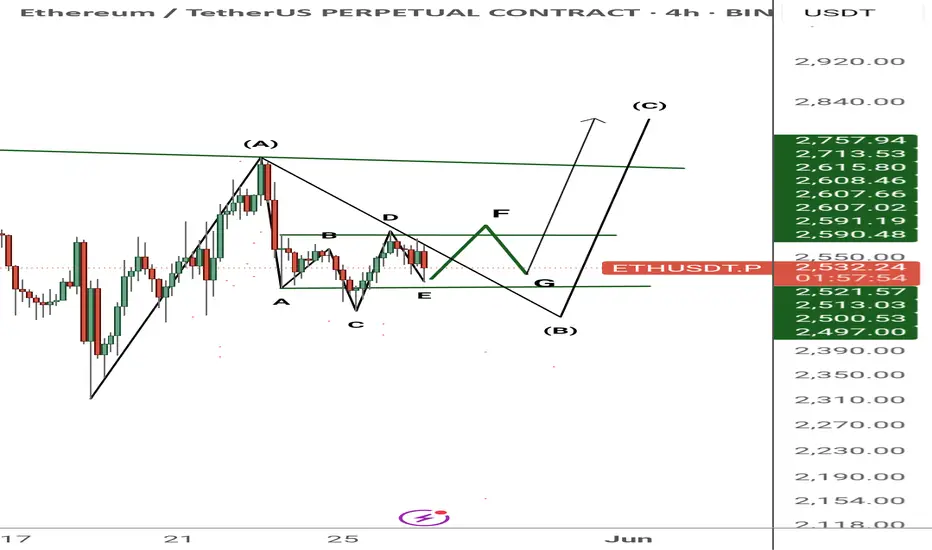
A rare and clean Symmetrical Diametric seems to be unfolding on the 4H ETH/USDT chart, following Glenn Neely’s advanced NeoWave principles.
Current Structure:
Waves A, B, C, D, and E have completed
All legs are nearly equal in time with clear directional alternation
Wave E retraced exactly 61.8% of Wave D, confirming symmetry
What's Next?
Wave F is likely starting now — expect an upward move
If correct, Higher High (HH) will be formed above Wave E
After that, Wave G will complete the 7-legged diametric with a Higher Low (HL) structure
Key Observations:
Time symmetry = strong confirmation for a Symmetrical Diametric
Current range: $2,500–2,610
Break above $2,590 will reinforce bullish Wave F development
Trading Outlook:
Watch for bullish confirmation near $2,540–2,550 zone
Wave F may target the $2,590–2,610 resistance zone
Final Wave G could offer a buy-the-dip opportunity if it respects symmetry
Pattern: Symmetrical Diametric
Current Wave: Likely beginning of Wave F
Bias: Short-term bullish, mid-term neutral (until Wave G ends)
DYOR – This is not financial advice.
Share your thoughts below — Do you also see the Diametric?

 ETHUSDT
  BTCUSDT ETHUSDT.P ETHBTC ETHUSDT.P
---
A rare and clean Symmetrical Diametric seems to be unfolding on the 4H ETH/USDT chart, following Glenn Neely’s advanced NeoWave principles.
Current Structure:
Waves A, B, C, D, and E have completed
All legs are nearly equal in time with clear directional alternation
Wave E retraced exactly 61.8% of Wave D, confirming symmetry
What's Next?
Wave F is likely starting now — expect an upward move
If correct, Higher High (HH) will be formed above Wave E
After that, Wave G will complete the 7-legged diametric with a Higher Low (HL) structure
Key Observations:
Time symmetry = strong confirmation for a Symmetrical Diametric
Current range: $2,500–2,610
Break above $2,590 will reinforce bullish Wave F development
Trading Outlook:
Watch for bullish confirmation near $2,540–2,550 zone
Wave F may target the $2,590–2,610 resistance zone
Final Wave G could offer a buy-the-dip opportunity if it respects symmetry
Pattern: Symmetrical Diametric
Current Wave: Likely beginning of Wave F
Bias: Short-term bullish, mid-term neutral (until Wave G ends)
DYOR – This is not financial advice.
Share your thoughts below — Do you also see the Diametric?
Declinazione di responsabilità
Le informazioni ed i contenuti pubblicati non costituiscono in alcun modo una sollecitazione ad investire o ad operare nei mercati finanziari. Non sono inoltre fornite o supportate da TradingView. Maggiori dettagli nelle Condizioni d'uso.
Declinazione di responsabilità
Le informazioni ed i contenuti pubblicati non costituiscono in alcun modo una sollecitazione ad investire o ad operare nei mercati finanziari. Non sono inoltre fornite o supportate da TradingView. Maggiori dettagli nelle Condizioni d'uso.