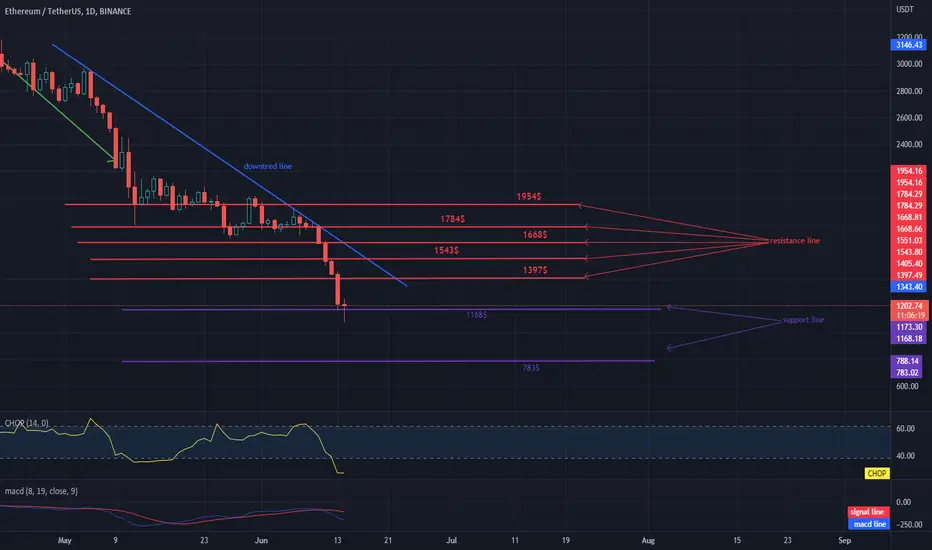
Hello everyone, let's take a look at the ETH to USDT chart on the 1 day time frame as you can see the price is moving below the downtrend line.
Let's start with the designation of the support line and as you can see the first support from which the price has already rebounded $ 1168, if the support is broken, the next one is $ 783
Now let's move from the resistance line as you can see the first resistance is $ 1,397, if you can break it the next resistance will be $ 1,543, $ 1,668, $ 1,784 and $ 1,954.
Looking at the CHOP indicator , we can see that the energy has been used for the current decline in the 1-day interval, while the MACD indicator shows that we are in a downward trend.
Declinazione di responsabilità
Le informazioni ed i contenuti pubblicati non costituiscono in alcun modo una sollecitazione ad investire o ad operare nei mercati finanziari. Non sono inoltre fornite o supportate da TradingView. Maggiori dettagli nelle Condizioni d'uso.
Declinazione di responsabilità
Le informazioni ed i contenuti pubblicati non costituiscono in alcun modo una sollecitazione ad investire o ad operare nei mercati finanziari. Non sono inoltre fornite o supportate da TradingView. Maggiori dettagli nelle Condizioni d'uso.