Hello?
Traders, welcome.
If you "Follow", you can always get new information quickly.
Please also click "Boost".
Have a good day.
-------------------------------------
(ETHBTC 1W Chart)

We need to see if we can continue the uptrend along the uptrend line.
--------------------------------------
(ETHUSDT 1W chart)

The HA-Low line is still holding at 3962.19.
So, you can see that it hasn't had a rebound or a sharp uptrend yet.
In order to break this trend, it needs to show a rise above the downtrend line.
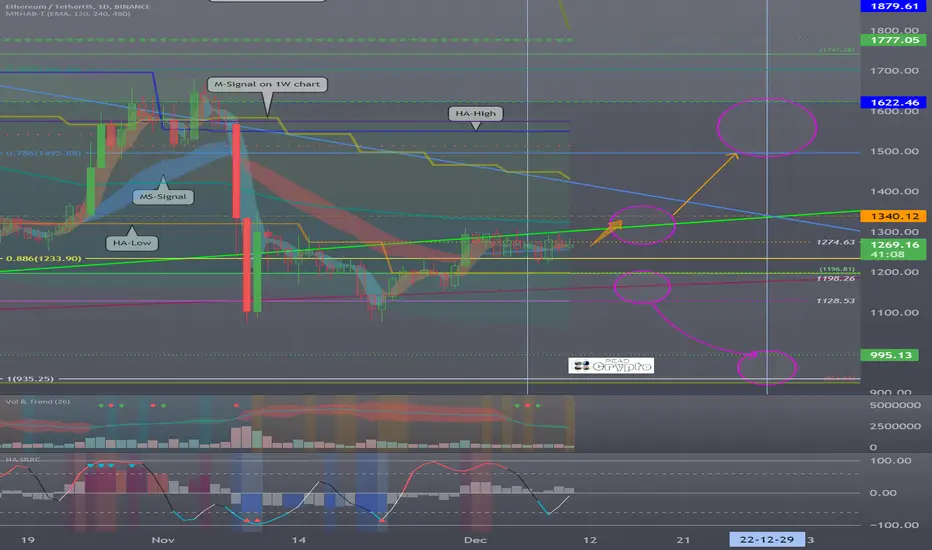
(1D chart)
On the BTC 1D chart, the -100 indicator is falling, creating a new trend, but ETH is still at the -100 indicator at 1777.05.
Therefore, the key is whether you can show a movement to show a new flow.
It is important to be able to come up with an upward trend crossing the uptrend line.
The next period of volatility is around December 29th.
-------------------------------------------------- -------------------------------------------
** All descriptions are for reference only and do not guarantee profit or loss in investment.
** If you share this chart, you can use the indicators normally.
** The MRHAB-T indicator includes indicators that indicate points of support and resistance.
** SR_R_C indicators are displayed as StochRSI (line), RSI (columns), and CCI (bgcolor).
** The CCI indicator is displayed in the overbought section (CCI > +100) and oversold section (CCI < -100).
(Short-term Stop Loss can be said to be a point where profit or loss can be preserved or additional entry can be made by split trading. This is a short-term investment perspective.)
---------------------------------
Traders, welcome.
If you "Follow", you can always get new information quickly.
Please also click "Boost".
Have a good day.
-------------------------------------
(ETHBTC 1W Chart)
We need to see if we can continue the uptrend along the uptrend line.
--------------------------------------
(ETHUSDT 1W chart)
The HA-Low line is still holding at 3962.19.
So, you can see that it hasn't had a rebound or a sharp uptrend yet.
In order to break this trend, it needs to show a rise above the downtrend line.
(1D chart)
On the BTC 1D chart, the -100 indicator is falling, creating a new trend, but ETH is still at the -100 indicator at 1777.05.
Therefore, the key is whether you can show a movement to show a new flow.
It is important to be able to come up with an upward trend crossing the uptrend line.
The next period of volatility is around December 29th.
-------------------------------------------------- -------------------------------------------
** All descriptions are for reference only and do not guarantee profit or loss in investment.
** If you share this chart, you can use the indicators normally.
** The MRHAB-T indicator includes indicators that indicate points of support and resistance.
** SR_R_C indicators are displayed as StochRSI (line), RSI (columns), and CCI (bgcolor).
** The CCI indicator is displayed in the overbought section (CCI > +100) and oversold section (CCI < -100).
(Short-term Stop Loss can be said to be a point where profit or loss can be preserved or additional entry can be made by split trading. This is a short-term investment perspective.)
---------------------------------
Other content (coins, stocks, etc.) is frequently posted on X.
X에 다른 내용(코인, 주식 등)이 자주 게시.
◆ t.me/readCryptoChannel
[HA-MS Indicator]
bit.ly/3YxHgvN
[OBV Indicator]
bit.ly/4dcyny3
X에 다른 내용(코인, 주식 등)이 자주 게시.
◆ t.me/readCryptoChannel
[HA-MS Indicator]
bit.ly/3YxHgvN
[OBV Indicator]
bit.ly/4dcyny3
Pubblicazioni correlate
Declinazione di responsabilità
Le informazioni ed i contenuti pubblicati non costituiscono in alcun modo una sollecitazione ad investire o ad operare nei mercati finanziari. Non sono inoltre fornite o supportate da TradingView. Maggiori dettagli nelle Condizioni d'uso.