Daily:

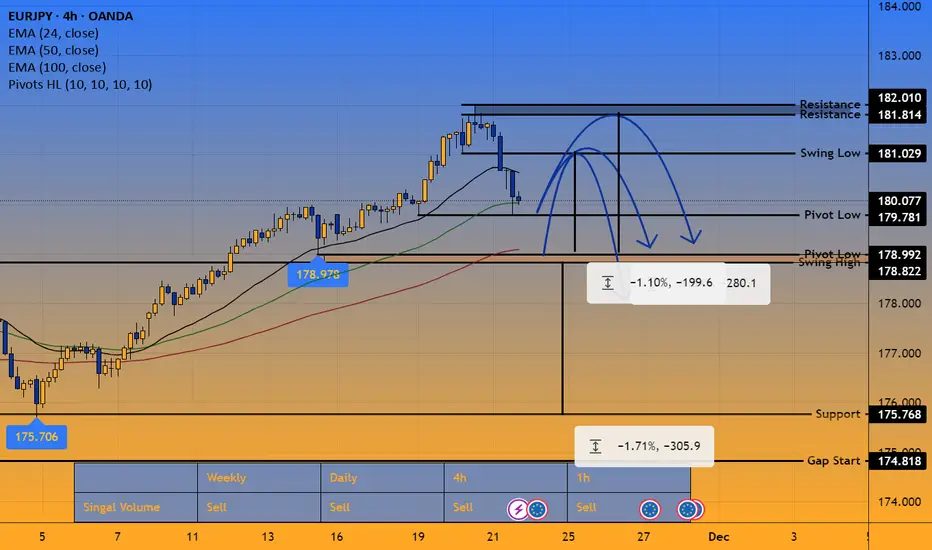
The pair closed the week with a textbook evening star, and the best part of it the move was supported by a slightly above average volume on the narrow and then the down candle. Giving this information I suspect the price will keep falling this week at least until 178.992, where we have a swing high a pivot and also is the Fibonacci 50. There are three scenarios which I will be observing and trying to capitalise on.
1. Big pullback all the way down to 175.768
2. Smaller pullback to 178.992 followed by a re-test of the high or the formation of LH. SELL
3. Monday opens gap down, and continues down all the week
4H:

Now, at 4HTF the first line of support has been tested once during the NY session, my plan is to wait for a pull back to 181.029 to then short down to 178.992 or if it doesn't stop at the swing wait for the test of the high. If it fails to reject here and continues lower my point of reference will be the next Support at 178.990. SELL
1H:

At 1HTF the MA is already positioning to move lower, obviously before any entries, I want to see a lower high on a higher timeframe, a test of the MA on 1HTF and all of it supported by higher volume on down candles. My bias is fully bearish as I've been fallowing the bullish move for the past week closely and it wasn't supported by volume much. A break below the support area 178.822/178.992 would be dream coming true as the next support is all the way down below 176.000. SELL
The Plan:
ALL SHORTS, NOT BUYING EVEN IF IT BREAKS THE HIGH
181.029 Rejection Target 179.054
181.814 Rejection Target 179.781
178.822 Breakout target 175.768 (Only after re-test)
Disclaimer: This are notes of what I do for my self every week, but usually I just save them as Private notes so I can keep track on my weekly plan. I decided to start publicly sharing them in the hope that they can be somehow helpful to anyone, and maybe learn something from you in the comments.
About me: I trade Support and Resistance both breakouts and rejections, usually my entries are after Hammers and Shooting stars on above average volume. I use VPA (Volume Prize Analysis) for all my analysis and entries. I do not post my Tick Volume indicator as I use different platform for it.
My Win%:
All time 45.05%
2025 45.51%
Q3 51.39%
Good Luck in your trading.
Thank you
The pair closed the week with a textbook evening star, and the best part of it the move was supported by a slightly above average volume on the narrow and then the down candle. Giving this information I suspect the price will keep falling this week at least until 178.992, where we have a swing high a pivot and also is the Fibonacci 50. There are three scenarios which I will be observing and trying to capitalise on.
1. Big pullback all the way down to 175.768
2. Smaller pullback to 178.992 followed by a re-test of the high or the formation of LH. SELL
3. Monday opens gap down, and continues down all the week
4H:
Now, at 4HTF the first line of support has been tested once during the NY session, my plan is to wait for a pull back to 181.029 to then short down to 178.992 or if it doesn't stop at the swing wait for the test of the high. If it fails to reject here and continues lower my point of reference will be the next Support at 178.990. SELL
1H:
At 1HTF the MA is already positioning to move lower, obviously before any entries, I want to see a lower high on a higher timeframe, a test of the MA on 1HTF and all of it supported by higher volume on down candles. My bias is fully bearish as I've been fallowing the bullish move for the past week closely and it wasn't supported by volume much. A break below the support area 178.822/178.992 would be dream coming true as the next support is all the way down below 176.000. SELL
The Plan:
ALL SHORTS, NOT BUYING EVEN IF IT BREAKS THE HIGH
181.029 Rejection Target 179.054
181.814 Rejection Target 179.781
178.822 Breakout target 175.768 (Only after re-test)
Disclaimer: This are notes of what I do for my self every week, but usually I just save them as Private notes so I can keep track on my weekly plan. I decided to start publicly sharing them in the hope that they can be somehow helpful to anyone, and maybe learn something from you in the comments.
About me: I trade Support and Resistance both breakouts and rejections, usually my entries are after Hammers and Shooting stars on above average volume. I use VPA (Volume Prize Analysis) for all my analysis and entries. I do not post my Tick Volume indicator as I use different platform for it.
My Win%:
All time 45.05%
2025 45.51%
Q3 51.39%
Good Luck in your trading.
Thank you
Nota
Monday Update: Weak Yen and Strong Euro today pushed the pair higher, and I was glad to see this move as is getting closer to levels of interest, I did not engage in the rejection of 181.029 as planned, due to the weakness of the Yen, would be a high risk position. At time of writing a kind of a HL is forming which is also good, it opens the possibility for a double top at 181.029 where hopefully tomorrow we can capitalise on, hopefully the move will wait for me to wake up. In case of a break above this level I will just patiently for the next level 181.814. Volume wise all the day was moving up on below average, only after it touched 181.029 the volume started to increase, giving us a little cue that the market is weak at this point and bears are joining the opportunity. Declinazione di responsabilità
Le informazioni e le pubblicazioni non sono intese come, e non costituiscono, consulenza o raccomandazioni finanziarie, di investimento, di trading o di altro tipo fornite o approvate da TradingView. Per ulteriori informazioni, consultare i Termini di utilizzo.
Declinazione di responsabilità
Le informazioni e le pubblicazioni non sono intese come, e non costituiscono, consulenza o raccomandazioni finanziarie, di investimento, di trading o di altro tipo fornite o approvate da TradingView. Per ulteriori informazioni, consultare i Termini di utilizzo.