Combining H1 and 5-Minute Charts for Tomorrow’s Trading Plan
Based on the technical analysis of both the H1 and 5-minute charts, the following conclusions and trading strategies can be drawn:
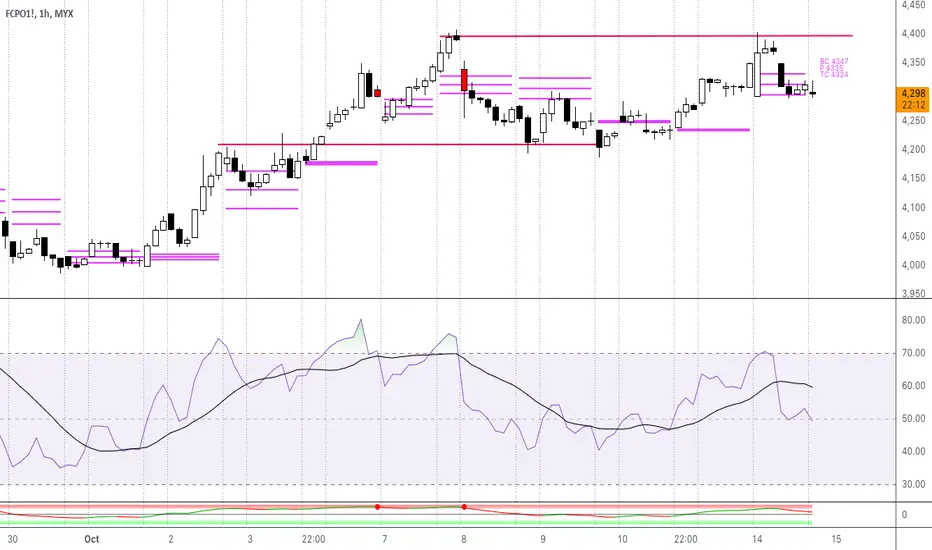
Watch for a Breakout Above 4,400 (H1):
A confirmed breakout above the 4,400 resistance level on the H1 chart could provide an opportunity for long positions, targeting 4,450 and possibly higher. The key is to wait for a strong bullish confirmation with accompanying volume.
4,240 Support Holds the Key (H1):
Should the price fail to hold 4,240 on the H1 chart, a significant downside move could occur. Look for short opportunities with potential targets around 4,200 and possibly 4,160.
Intraday Focus on 4,320 - 4,300 Zone (5-Minute Chart):
On the 5-minute chart, the market is showing signs of exhaustion. If the 4,300 support holds in early trading tomorrow, a quick bounce toward 4,320 is likely. However, if 4,300 is broken, look for a potential move lower.
RSI and Momentum Indicators:
Keep an eye on the RSI for any signs of divergence or overbought/oversold conditions, as these could provide early warning signs for reversals.
Based on the technical analysis of both the H1 and 5-minute charts, the following conclusions and trading strategies can be drawn:
Watch for a Breakout Above 4,400 (H1):
A confirmed breakout above the 4,400 resistance level on the H1 chart could provide an opportunity for long positions, targeting 4,450 and possibly higher. The key is to wait for a strong bullish confirmation with accompanying volume.
4,240 Support Holds the Key (H1):
Should the price fail to hold 4,240 on the H1 chart, a significant downside move could occur. Look for short opportunities with potential targets around 4,200 and possibly 4,160.
Intraday Focus on 4,320 - 4,300 Zone (5-Minute Chart):
On the 5-minute chart, the market is showing signs of exhaustion. If the 4,300 support holds in early trading tomorrow, a quick bounce toward 4,320 is likely. However, if 4,300 is broken, look for a potential move lower.
RSI and Momentum Indicators:
Keep an eye on the RSI for any signs of divergence or overbought/oversold conditions, as these could provide early warning signs for reversals.
Nota
See full analysis from masterfcpotrading.com/daily-analysis/14-october-2024/Declinazione di responsabilità
Le informazioni e le pubblicazioni non sono intese come, e non costituiscono, consulenza o raccomandazioni finanziarie, di investimento, di trading o di altro tipo fornite o approvate da TradingView. Per ulteriori informazioni, consultare i Termini di utilizzo.
Declinazione di responsabilità
Le informazioni e le pubblicazioni non sono intese come, e non costituiscono, consulenza o raccomandazioni finanziarie, di investimento, di trading o di altro tipo fornite o approvate da TradingView. Per ulteriori informazioni, consultare i Termini di utilizzo.