Significance of the interval 0.5366-0.6321...
Hello?
Traders, welcome.
If you "Follow", you can always get new information quickly.
Please also click "Boost".
Have a good day.
-------------------------------------
(FTMBTC 1W chart)

The key is whether it can rise with support around 0.0000 1686 ~ 0.0000 2029.
--------------------------------------
(FTMUSDT chart)

(1W chart)

The question is whether it can hold the price above 0.4254 and rise above 0.6321.
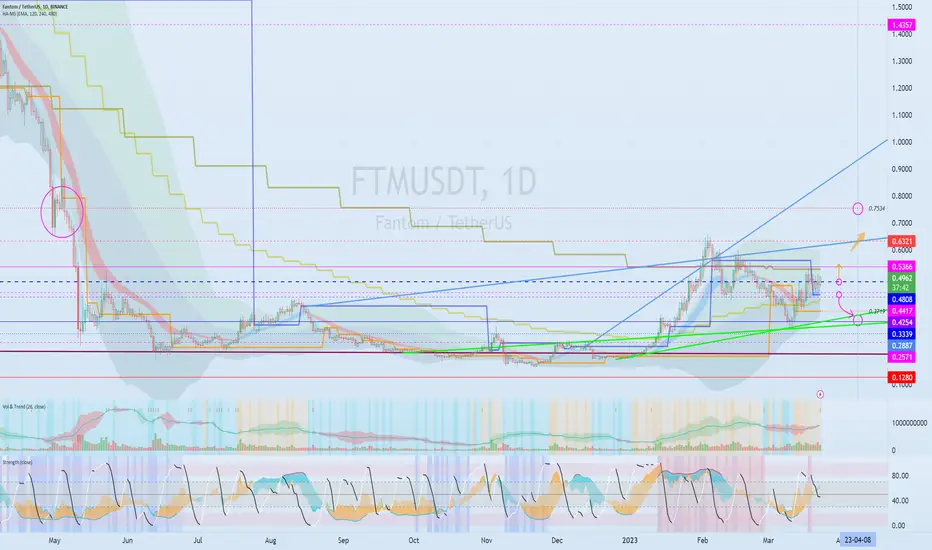
(1D chart)
The key is whether it can rise with support around 0.5366-0.6321.
Therefore, if it rises above 0.7534, it is expected to show a sharp uptrend.
To do so, we need to see if the price can be maintained around 0.4808.
A drop from 0.4808 is likely to touch around 0.3339-0.3719.
-------------------------------------------------- -------------------------------------------
** All descriptions are for reference only and do not guarantee profit or loss in investment.
** Even if you know other people's know-how, it takes a considerable period of time to make it your own.
** This is a chart created with my know-how.
---------------------------------
Traders, welcome.
If you "Follow", you can always get new information quickly.
Please also click "Boost".
Have a good day.
-------------------------------------
(FTMBTC 1W chart)
The key is whether it can rise with support around 0.0000 1686 ~ 0.0000 2029.
--------------------------------------
(FTMUSDT chart)
(1W chart)
The question is whether it can hold the price above 0.4254 and rise above 0.6321.
(1D chart)
The key is whether it can rise with support around 0.5366-0.6321.
Therefore, if it rises above 0.7534, it is expected to show a sharp uptrend.
To do so, we need to see if the price can be maintained around 0.4808.
A drop from 0.4808 is likely to touch around 0.3339-0.3719.
-------------------------------------------------- -------------------------------------------
** All descriptions are for reference only and do not guarantee profit or loss in investment.
** Even if you know other people's know-how, it takes a considerable period of time to make it your own.
** This is a chart created with my know-how.
---------------------------------
※ Follow X to check out the posts.
※ X를 팔로우하고 게시물을 확인하세요.
◆ t.me/readCryptoChannel
[HA-MS Indicator]
bit.ly/3YxHgvN
[OBV Indicator]
bit.ly/4dcyny3
※ X를 팔로우하고 게시물을 확인하세요.
◆ t.me/readCryptoChannel
[HA-MS Indicator]
bit.ly/3YxHgvN
[OBV Indicator]
bit.ly/4dcyny3
Pubblicazioni correlate
Declinazione di responsabilità
Le informazioni e le pubblicazioni non sono intese come, e non costituiscono, consulenza o raccomandazioni finanziarie, di investimento, di trading o di altro tipo fornite o approvate da TradingView. Per ulteriori informazioni, consultare i Termini di utilizzo.