Technical Analysis Of GBPCAD
1. Trend Shift
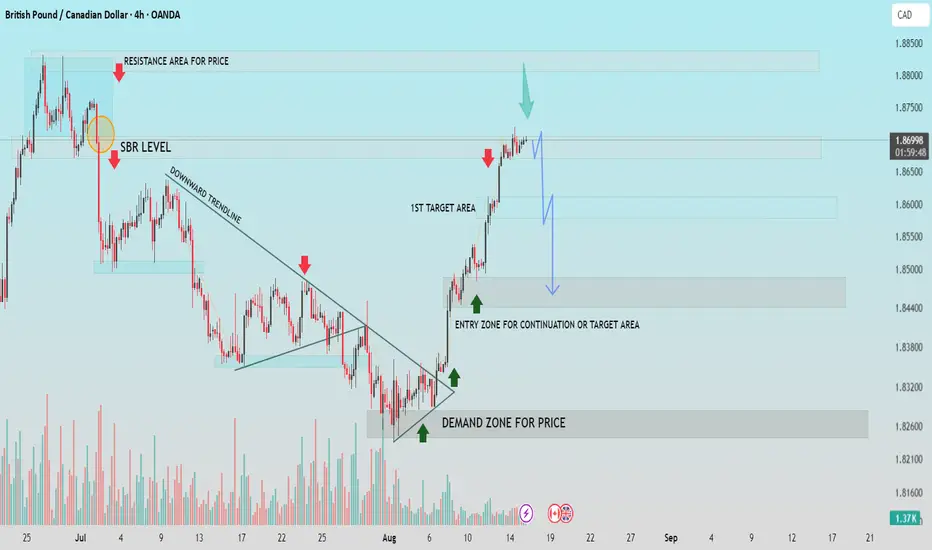
Price broke out of a long-standing downward trendline, signaling a change in market sentiment from bearish to bullish. This breakout was confirmed by strong buying pressure from the demand zone (1.8250-1.8300).
2. Demand Zone Reaction
The demand zone acted as a strong support area where buyers stepped in aggressively. This created a base for the rally, pushing price through the trendline and initiating an upward momentum.
3. Resistance / SBR Level
The market is now testing a Significant Resistance Turned Support (SBR) level around 1.8700-1.8750. This is a historically strong supply area, as marked by previous price rejections.
4. First Target Achieved
The first target area near 1.8600 has already been reached after the breakout. Price has extended higher toward the major resistance zone, showing bullish strength.
5. Short-Term Outlook
Currently, price is stalling at resistance, and a short-term correction toward 1.8500-1.8440 is likely before deciding its next direction.
* Bearish Case: Strong rejection at resistance could trigger a deeper retracement.
* Bullish Case: A decisive breakout above 1.8750 may open the path toward higher highs.
Trading Bias
📉 Short-Term: Bearish correction possible.
📈 Medium-Term: Bullish continuation if support holds after pullback.
If this helpful for you, press the like button.
1. Trend Shift
Price broke out of a long-standing downward trendline, signaling a change in market sentiment from bearish to bullish. This breakout was confirmed by strong buying pressure from the demand zone (1.8250-1.8300).
2. Demand Zone Reaction
The demand zone acted as a strong support area where buyers stepped in aggressively. This created a base for the rally, pushing price through the trendline and initiating an upward momentum.
3. Resistance / SBR Level
The market is now testing a Significant Resistance Turned Support (SBR) level around 1.8700-1.8750. This is a historically strong supply area, as marked by previous price rejections.
4. First Target Achieved
The first target area near 1.8600 has already been reached after the breakout. Price has extended higher toward the major resistance zone, showing bullish strength.
5. Short-Term Outlook
Currently, price is stalling at resistance, and a short-term correction toward 1.8500-1.8440 is likely before deciding its next direction.
* Bearish Case: Strong rejection at resistance could trigger a deeper retracement.
* Bullish Case: A decisive breakout above 1.8750 may open the path toward higher highs.
Trading Bias
📉 Short-Term: Bearish correction possible.
📈 Medium-Term: Bullish continuation if support holds after pullback.
If this helpful for you, press the like button.
Trade attivo
Trade chiuso manualmente
💸FREE FOREX Signals in Telegram : t.me/FxInsightsHub0
🔹Join Our Telegram Channel, Pure Price Action Based Signals With Chart Analysis.
t.me/FxInsightsHub0
🚀FREE CRYPTO Signals In Telegram: t.me/FxInsightsHub0
🔹Join Our Telegram Channel, Pure Price Action Based Signals With Chart Analysis.
t.me/FxInsightsHub0
🚀FREE CRYPTO Signals In Telegram: t.me/FxInsightsHub0
Pubblicazioni correlate
Declinazione di responsabilità
Le informazioni ed i contenuti pubblicati non costituiscono in alcun modo una sollecitazione ad investire o ad operare nei mercati finanziari. Non sono inoltre fornite o supportate da TradingView. Maggiori dettagli nelle Condizioni d'uso.