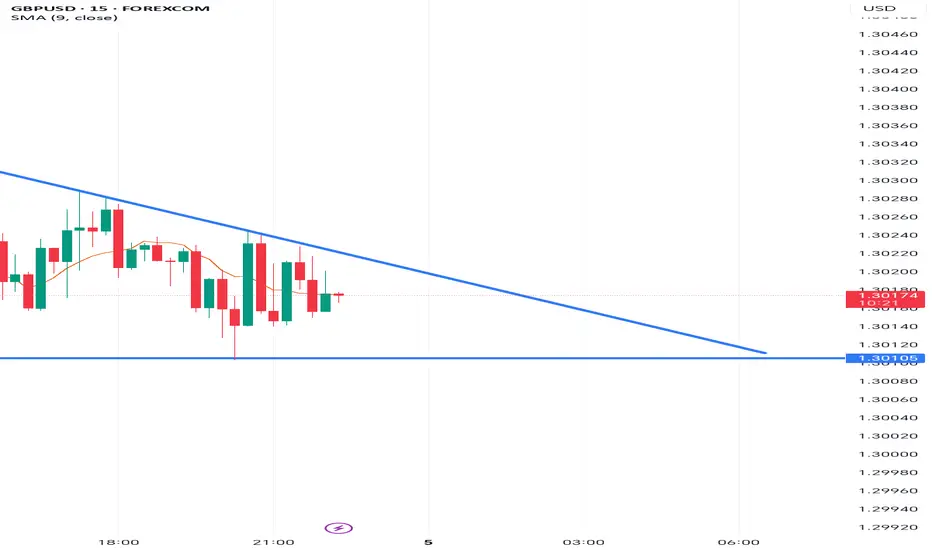
GBP/USD on the 15-minute chart is forming a descending triangle pattern, indicating potential bearish continuation pressure. The pair is currently trading around 1.3017, testing the strong horizontal support zone near 1.3010, while lower highs are being capped by a descending trendline resistance.
The 9-period SMA is trending slightly downward, reinforcing short-term bearish momentum. A break below 1.3010 could trigger a sharper move toward the 1.2990–1.2980 area. Conversely, if bulls manage to defend this support and push above the descending trendline, we could see a relief rally toward 1.3035–1.3050.
Trading Plan:
📉 Sell below 1.3010 with targets at 1.2990 / 1.2975, stop loss above 1.3025.
📈 Buy above 1.3035 with targets at 1.3055 / 1.3070, stop loss below 1.3015.
Bias: Bearish while below trendline resistance.
Pattern: Descending Triangle
Timeframe: 15M
📊 Keep an eye on the breakout — the next candle could confirm direction.
Declinazione di responsabilità
Le informazioni e le pubblicazioni non sono intese come, e non costituiscono, consulenza o raccomandazioni finanziarie, di investimento, di trading o di altro tipo fornite o approvate da TradingView. Per ulteriori informazioni, consultare i Termini di utilizzo.
Declinazione di responsabilità
Le informazioni e le pubblicazioni non sono intese come, e non costituiscono, consulenza o raccomandazioni finanziarie, di investimento, di trading o di altro tipo fornite o approvate da TradingView. Per ulteriori informazioni, consultare i Termini di utilizzo.