📊 Current Intraday Snapshot
Day’s range: approx ₹ 2,187.10 (low) to ₹ 2,225.90 (high).
Recent price hovering around ₹ 2,213-2,225 region.
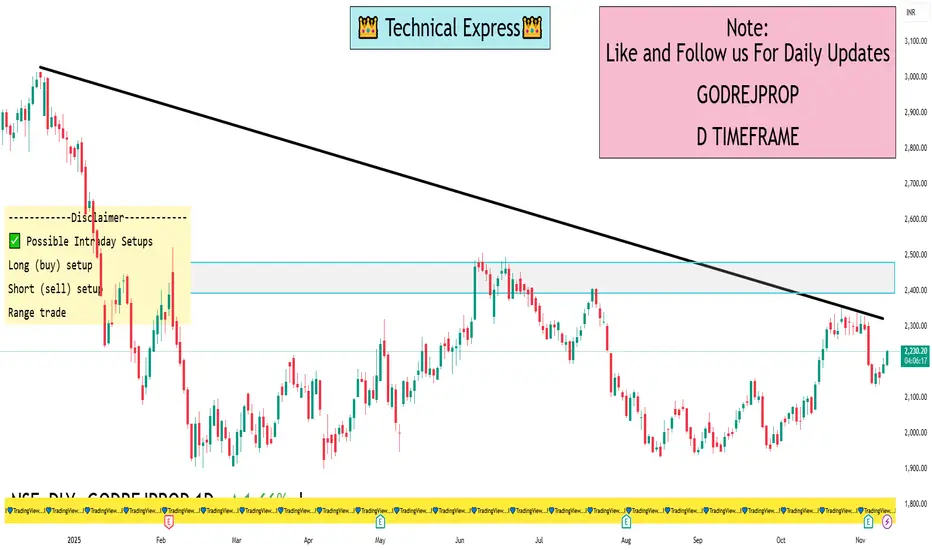
52-week range: ~ ₹ 1,900 (low) to ₹ 3,015.90 (high).
🔍 Key Levels to Watch (1-Day)
Support zone: The lower end of today’s range (~ ₹ 2,187) acts as immediate support. If price falls below this, short-term weakness may show up.
Resistance zone: The upper end (~ ₹ 2,225-2,226) is the immediate intraday resistance. A clean breakout above this with volume could open a momentum leg.
Mid-range pivot: Around ~ ₹ 2,210-2,220 could act as a pivot region — price consolidating here may indicate indecision before a directional move.
If breakout up: If price breaks above ~ ₹ 2,225 with conviction, next upside may target maybe ~ ₹ 2,250-2,270 (intraday extension zone) though this requires confirmation.
If breakdown: If price drops below ~ ₹ 2,187, downside could test prior support zones (which might lie closer to ~ ₹ 2,150-2,160 based on recent history) though I don’t have that exact level today.
✅ Possible Intraday Setups
Long (buy) setup: Wait for price to break above resistance (~ ₹ 2,225) with strong volume → enter long with stop just below pivot (~ ₹ 2,210) → target near ~ ₹ 2,250-2,270.
Short (sell) setup: If price drops and closes below support (~ ₹ 2,187) and shows weakness → enter short with stop just above pivot (~ ₹ 2,210) → target maybe ~ ₹ 2,150-2,160.
Range trade: If price stays between support and resistance (₹ 2,187-₹ 2,225) → consider trading the range: buy near support, sell near resistance, with tight risk control.
Day’s range: approx ₹ 2,187.10 (low) to ₹ 2,225.90 (high).
Recent price hovering around ₹ 2,213-2,225 region.
52-week range: ~ ₹ 1,900 (low) to ₹ 3,015.90 (high).
🔍 Key Levels to Watch (1-Day)
Support zone: The lower end of today’s range (~ ₹ 2,187) acts as immediate support. If price falls below this, short-term weakness may show up.
Resistance zone: The upper end (~ ₹ 2,225-2,226) is the immediate intraday resistance. A clean breakout above this with volume could open a momentum leg.
Mid-range pivot: Around ~ ₹ 2,210-2,220 could act as a pivot region — price consolidating here may indicate indecision before a directional move.
If breakout up: If price breaks above ~ ₹ 2,225 with conviction, next upside may target maybe ~ ₹ 2,250-2,270 (intraday extension zone) though this requires confirmation.
If breakdown: If price drops below ~ ₹ 2,187, downside could test prior support zones (which might lie closer to ~ ₹ 2,150-2,160 based on recent history) though I don’t have that exact level today.
✅ Possible Intraday Setups
Long (buy) setup: Wait for price to break above resistance (~ ₹ 2,225) with strong volume → enter long with stop just below pivot (~ ₹ 2,210) → target near ~ ₹ 2,250-2,270.
Short (sell) setup: If price drops and closes below support (~ ₹ 2,187) and shows weakness → enter short with stop just above pivot (~ ₹ 2,210) → target maybe ~ ₹ 2,150-2,160.
Range trade: If price stays between support and resistance (₹ 2,187-₹ 2,225) → consider trading the range: buy near support, sell near resistance, with tight risk control.
I built a Buy & Sell Signal Indicator with 85% accuracy.
📈 Get access via DM or
WhatsApp: wa.link/d997q0
Contact - +91 76782 40962
| Email: techncialexpress@gmail.com
| Script Coder | Trader | Investor | From India
📈 Get access via DM or
WhatsApp: wa.link/d997q0
Contact - +91 76782 40962
| Email: techncialexpress@gmail.com
| Script Coder | Trader | Investor | From India
Pubblicazioni correlate
Declinazione di responsabilità
Le informazioni e le pubblicazioni non sono intese come, e non costituiscono, consulenza o raccomandazioni finanziarie, di investimento, di trading o di altro tipo fornite o approvate da TradingView. Per ulteriori informazioni, consultare i Termini di utilizzo.