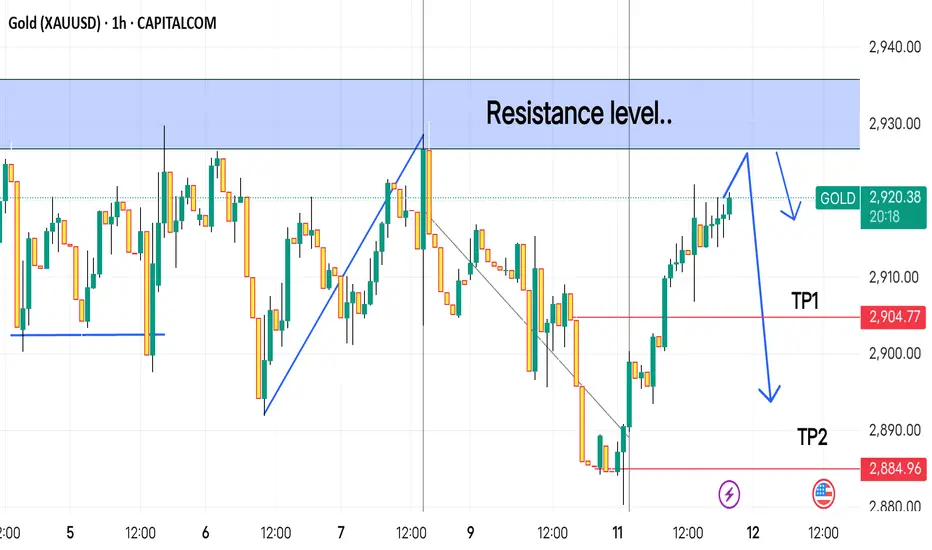
This is a technical analysis chart for Gold (XAU/USD) on the 1-hour timeframe, published on TradingView. Here’s what it suggests:
1. Resistance Level (Blue Zone):
The price is approaching a key resistance area around $2,930.
This level has been tested before and could act as a strong barrier.
2. Potential Reversal Setup (Blue Arrow):
The chart suggests that gold may reverse down from this resistance.
A downward arrow indicates a possible short (sell) trade setup.
3. Take Profit (TP) Targets:
TP1 (First Target): Around $2,904.77
TP2 (Second Target): Around $2,884.96
These levels are where traders might consider closing their short positions.
4. Price Action & Trend Analysis:
The price previously formed a descending channel (red and blue shaded area).
It has now broken out of that channel and is testing the resistance.
Conclusion:
This chart suggests a potential sell opportunity if the price respects the resistance. If gold gets rejected at this level, it could
Declinazione di responsabilità
Le informazioni ed i contenuti pubblicati non costituiscono in alcun modo una sollecitazione ad investire o ad operare nei mercati finanziari. Non sono inoltre fornite o supportate da TradingView. Maggiori dettagli nelle Condizioni d'uso.
Declinazione di responsabilità
Le informazioni ed i contenuti pubblicati non costituiscono in alcun modo una sollecitazione ad investire o ad operare nei mercati finanziari. Non sono inoltre fornite o supportate da TradingView. Maggiori dettagli nelle Condizioni d'uso.