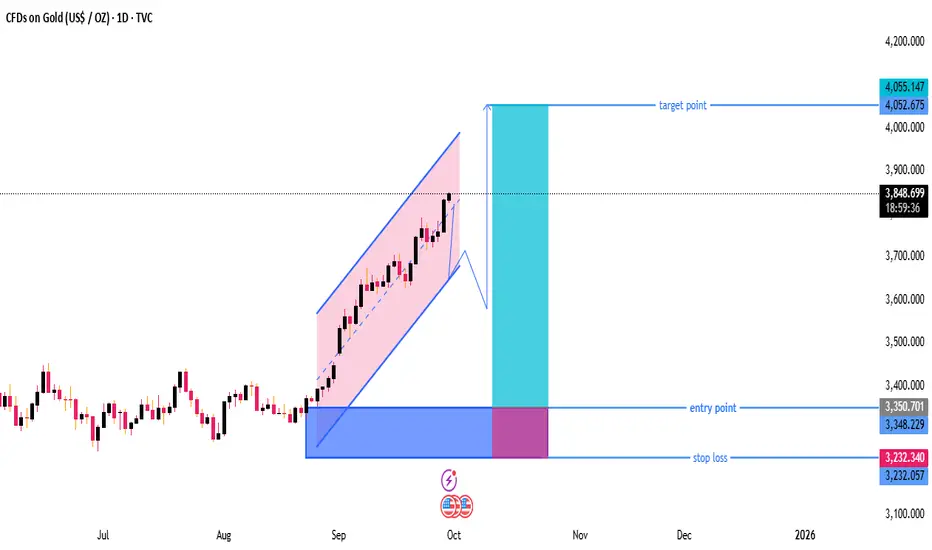
he chart shows XAU/USD (Gold) on a daily timeframe.
Price is currently trading around 3,848, within a rising parallel channel.
A possible pullback from the channel top is indicated before a move higher toward the target.
---
Key Levels & Zones
Entry Point:
Around 3,350 zone marked as the ideal buy area.
This is near the lower support region of previous consolidation.
Stop Loss:
Placed around 3,232, which is below key support.
Good for risk management — avoids staying in trade if price breaks structure.
Target Point:
Around 4,052 – 4,055, aligning with the measured move from the breakout of the channel.
This gives a strong risk-to-reward ratio (roughly 2.5:1).
---
Technical Structure
Trend: Strong uptrend – price respecting ascending channel.
Momentum: Higher highs and higher lows confirm bullish market structure.
Possible Scenario:
1. Short-term pullback expected to lower boundary or breakout retest zone.
2. Continuation move upward toward target (around 4,050).
---
Trading Plan Based on Chart
Wait for Pullback: Don’t buy at current level; price might retrace before next leg.
Enter near 3,350: Ideal long position entry point.
Stop Loss: 3,232 (safe under last swing low).
Target: 4,052–4,055 (previous high / projected channel top).
---
Summary
✅ Bias: Bullish (Buy-the-dip strategy)
📈 Entry: ~3,350
⛔ Stop Loss: ~3,232
🎯 Target: ~4,050
📊 Risk/Reward: Favorable — approx. 1:3
This setup is swing-trade friendly and follows trend continuation logic.
join my telegram channel t.me/goldmitalteamhttps://t.me/goldmitalteam
Declinazione di responsabilità
Le informazioni ed i contenuti pubblicati non costituiscono in alcun modo una sollecitazione ad investire o ad operare nei mercati finanziari. Non sono inoltre fornite o supportate da TradingView. Maggiori dettagli nelle Condizioni d'uso.