🔹Technical Analysis: Gold (XAU/USD) – 30-Minute Chart
▪️Support and Resistance Levels
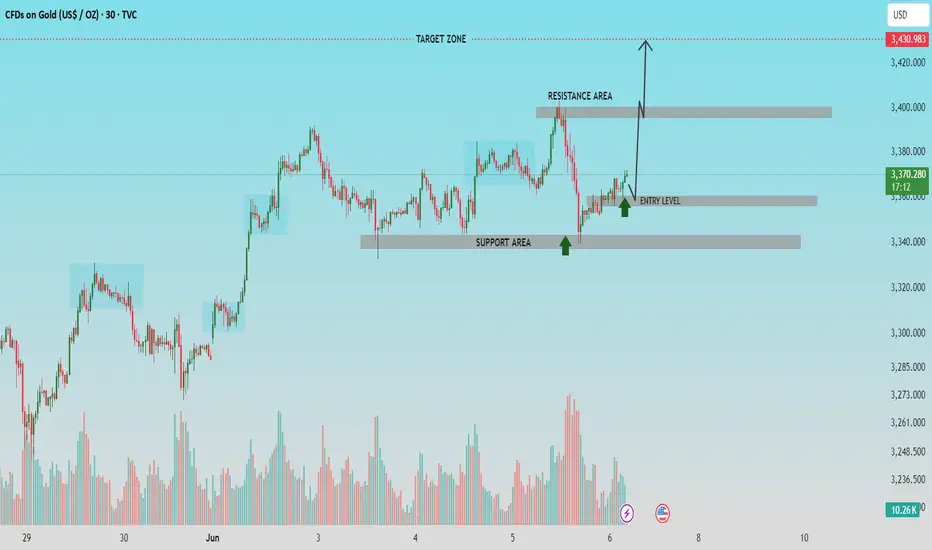
▪️ Support Area: The price has shown strong buying interest near the $3,345-$3,350 zone, where price action reversed with bullish momentum.
▪️ Resistance Area: Price faces significant resistance near the $3,395-$3,405 region, which acted as a previous supply zone.
🔹Entry and Target
▪️ Entry Level: The chart suggests an ideal buy entry around the $3,360-$3,365 level after the recent support confirmation (green arrows).
▪️ Target Zone: The projected upside target is around $3,430, representing a clean break and continuation above the resistance area.
▪️Outlook
The market shows a bullish structure after bouncing off the support area and breaking minor consolidation. A breakout above the resistance zone could lead to a rally towards the target zone. Traders should monitor for bullish confirmation above the resistance area for continuation.
▪️Volume Observation
An increase in bullish volume supports the likelihood of upward momentum, reinforcing the potential for a breakout.
▪️Bias: Bullish, with confirmation above resistance.
🔹Community Insight:
If you find this analysis helpful in your trading journey, feel free to share your thoughts or questions in the comments. Let’s work together to maintain a disciplined, technical approach to the markets.
▪️Follow for regular updates and trade setups.
Nota
trade running 100 pips+💸FREE FOREX Signals in Telegram : t.me/FxInsightsHub0
🔹Join Our Telegram Channel, Pure Price Action Based Signals With Chart Analysis.
t.me/FxInsightsHub0
🚀FREE CRYPTO Signals In Telegram: t.me/FxInsightsHub0
🔹Join Our Telegram Channel, Pure Price Action Based Signals With Chart Analysis.
t.me/FxInsightsHub0
🚀FREE CRYPTO Signals In Telegram: t.me/FxInsightsHub0
Pubblicazioni correlate
Declinazione di responsabilità
Le informazioni ed i contenuti pubblicati non costituiscono in alcun modo una sollecitazione ad investire o ad operare nei mercati finanziari. Non sono inoltre fornite o supportate da TradingView. Maggiori dettagli nelle Condizioni d'uso.
💸FREE FOREX Signals in Telegram : t.me/FxInsightsHub0
🔹Join Our Telegram Channel, Pure Price Action Based Signals With Chart Analysis.
t.me/FxInsightsHub0
🚀FREE CRYPTO Signals In Telegram: t.me/FxInsightsHub0
🔹Join Our Telegram Channel, Pure Price Action Based Signals With Chart Analysis.
t.me/FxInsightsHub0
🚀FREE CRYPTO Signals In Telegram: t.me/FxInsightsHub0
Pubblicazioni correlate
Declinazione di responsabilità
Le informazioni ed i contenuti pubblicati non costituiscono in alcun modo una sollecitazione ad investire o ad operare nei mercati finanziari. Non sono inoltre fornite o supportate da TradingView. Maggiori dettagli nelle Condizioni d'uso.
