SMC Trading point update
Technical analysis of (XAU/USD) on the 4-hour timeframe, highlighting a move toward the $3,450 target. Here's the full technical breakdown
---
Technical Analysis – Gold (4H)
1. Breakout from Resistance Zone
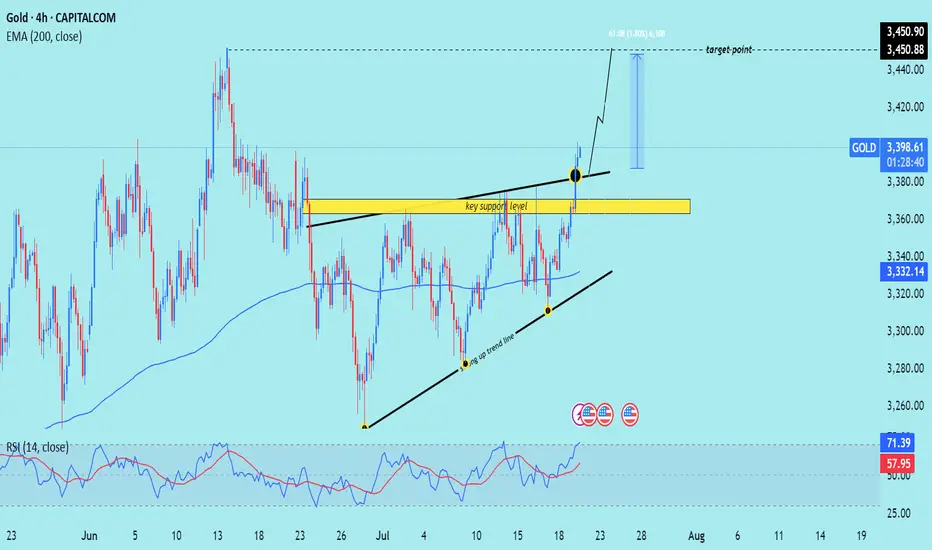
Price has broken above a key horizontal resistance level (now turned support, marked in yellow).
The breakout is confirmed by a strong bullish candle with momentum, suggesting buyers are in control.
2. Ascending Triangle Formation
Price formed an ascending triangle, a classic bullish continuation pattern.
The breakout above the upper boundary confirms the pattern, projecting a potential measured move.
3. Trendline Support & Higher Lows
The structure shows a rising trendline (black), where price bounced multiple times — confirming a higher low sequence.
The confluence of trendline support + breakout level adds strength to the bullish case.
4. 200 EMA Confluence
The 200-period EMA (3,332.13) has been acting as a dynamic support throughout.
Price retested it earlier in the move, then surged upward — validating trend continuation.
5. RSI Indicator
RSI is at 71.13, entering overbought territory.
This implies strong bullish momentum, but a short-term pullback to retest the breakout level is possible.
6. Target Projection
Target Point: $3,450.90, calculated from the height of the triangle (~61 pts or 1.80%) added above the breakout zone.
A retest of the breakout area (yellow zone) around $3,370–$3,380 could offer a better entry before continuation.
Mr SMC Trading point
---
Summary
Bias: Bullish
Current Price: $3,397.62
Support: $3,370–$3,380 zone (previous resistance turned support)
Trend: Higher lows + breakout above resistance
EMA Support: 200 EMA at $3,332.13
Target: $3,450.90
RSI: 71.13 – bullish but near overbought
Please support boost 🚀 this analysis)
Technical analysis of (XAU/USD) on the 4-hour timeframe, highlighting a move toward the $3,450 target. Here's the full technical breakdown
---
Technical Analysis – Gold (4H)
1. Breakout from Resistance Zone
Price has broken above a key horizontal resistance level (now turned support, marked in yellow).
The breakout is confirmed by a strong bullish candle with momentum, suggesting buyers are in control.
2. Ascending Triangle Formation
Price formed an ascending triangle, a classic bullish continuation pattern.
The breakout above the upper boundary confirms the pattern, projecting a potential measured move.
3. Trendline Support & Higher Lows
The structure shows a rising trendline (black), where price bounced multiple times — confirming a higher low sequence.
The confluence of trendline support + breakout level adds strength to the bullish case.
4. 200 EMA Confluence
The 200-period EMA (3,332.13) has been acting as a dynamic support throughout.
Price retested it earlier in the move, then surged upward — validating trend continuation.
5. RSI Indicator
RSI is at 71.13, entering overbought territory.
This implies strong bullish momentum, but a short-term pullback to retest the breakout level is possible.
6. Target Projection
Target Point: $3,450.90, calculated from the height of the triangle (~61 pts or 1.80%) added above the breakout zone.
A retest of the breakout area (yellow zone) around $3,370–$3,380 could offer a better entry before continuation.
Mr SMC Trading point
---
Summary
Bias: Bullish
Current Price: $3,397.62
Support: $3,370–$3,380 zone (previous resistance turned support)
Trend: Higher lows + breakout above resistance
EMA Support: 200 EMA at $3,332.13
Target: $3,450.90
RSI: 71.13 – bullish but near overbought
Please support boost 🚀 this analysis)
Trade chiuso: obiettivo raggiunto
(Services:✔️ JOIN Telegram channel
t.me/+BLfaeRJ48BBmNjM8
t.me/+BLfaeRJ48BBmNjM8
t.me/+BLfaeRJ48BBmNjM8
Join my recommended broker , link 👇
World best broker exness ✅D
one.exnesstrack.org/a/l1t1rf3p6v
t.me/+BLfaeRJ48BBmNjM8
t.me/+BLfaeRJ48BBmNjM8
t.me/+BLfaeRJ48BBmNjM8
Join my recommended broker , link 👇
World best broker exness ✅D
one.exnesstrack.org/a/l1t1rf3p6v
Pubblicazioni correlate
Declinazione di responsabilità
Le informazioni e le pubblicazioni non sono intese come, e non costituiscono, consulenza o raccomandazioni finanziarie, di investimento, di trading o di altro tipo fornite o approvate da TradingView. Per ulteriori informazioni, consultare i Termini di utilizzo.