Technical Analysis for Gold XAUUSD (4H Chart)
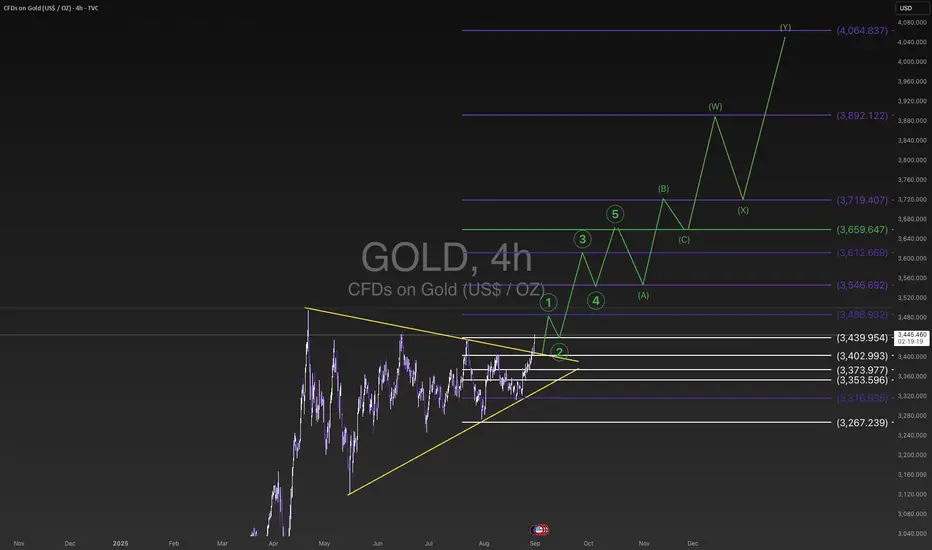
Gold has been consolidating within a symmetrical triangle pattern for several months. The recent breakout above the upper boundary signals the beginning of a new bullish wave supported by strong momentum.
🔹 According to the Elliott Wave scenario:
Wave (1) is expected to complete around the 3486 – 3546 USD zone.
A limited correction in Wave (2) may retrace towards 3439 – 3402 USD, serving as a potential support base before resuming the uptrend.
Wave (3), typically the strongest wave, could target 3612 – 3659 USD.
This would be followed by a Wave (4) pullback and then Wave (5), pushing prices towards 3719 USD.
🔹 In the medium term, the broader outlook suggests a WXY corrective structure, with targets as follows:
First target (W): 3719 USD
Second target (Y): 3892 USD
Extended target: 4064 USD
📌 Summary:
The overall trend remains bullish after the breakout from the symmetrical triangle.
Any short-term correction should be considered a buying opportunity as long as price holds above 3400 USD.
A break below 3267 USD would invalidate this scenario and open the door for further downside.
⚠️ This analysis is for educational/technical purposes only and not a direct buy/sell recommendation.
Declinazione di responsabilità
Le informazioni ed i contenuti pubblicati non costituiscono in alcun modo una sollecitazione ad investire o ad operare nei mercati finanziari. Non sono inoltre fornite o supportate da TradingView. Maggiori dettagli nelle Condizioni d'uso.
Declinazione di responsabilità
Le informazioni ed i contenuti pubblicati non costituiscono in alcun modo una sollecitazione ad investire o ad operare nei mercati finanziari. Non sono inoltre fornite o supportate da TradingView. Maggiori dettagli nelle Condizioni d'uso.