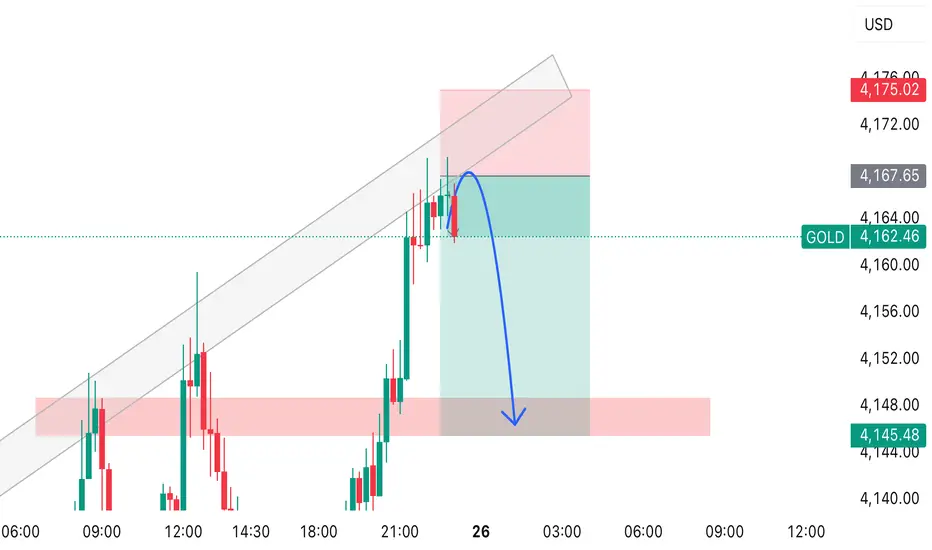
This TradingView chart shows GOLD price action approaching a resistance zone near 4167–4170 USD.
Price has been moving inside an ascending channel, shown with grey trendlines.
At the top of the channel, a rejection candle appears, and you’ve drawn a blue arrow indicating your expected move:
📉 Expected Move
• Price is expected to drop from the resistance zone.
• The arrow shows a move down towards the support demand zone near 4145–4150 USD (highlighted in red).
Trade attivo
Active Trade chiuso: obiettivo raggiunto
Target reached 🔥Declinazione di responsabilità
Le informazioni e le pubblicazioni non sono intese come, e non costituiscono, consulenza o raccomandazioni finanziarie, di investimento, di trading o di altro tipo fornite o approvate da TradingView. Per ulteriori informazioni, consultare i Termini di utilizzo.
Declinazione di responsabilità
Le informazioni e le pubblicazioni non sono intese come, e non costituiscono, consulenza o raccomandazioni finanziarie, di investimento, di trading o di altro tipo fornite o approvate da TradingView. Per ulteriori informazioni, consultare i Termini di utilizzo.