Although Alphabet has now printed a higher high, it will eventually need to print a higher low on the daily chart, above the Jan. 24 low-of-day, in order to confirm its uptrend. Bullish traders may watch for a reversal candlestick to print such as a doji or hammer to confirm the higher low is in.
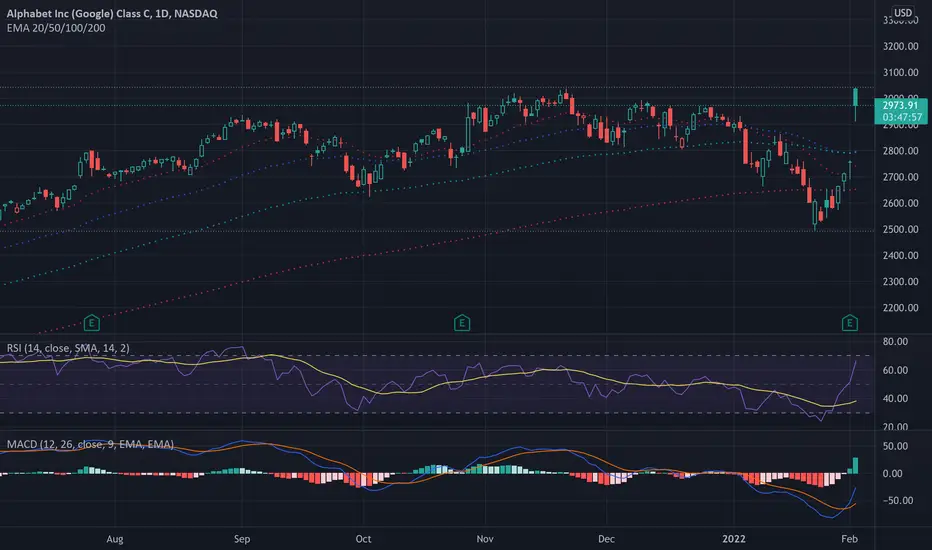
Alphabet is trading above the eight-day and 21-day exponential moving averages (EMAs) and the eight-day EMA is about to cross above the 21-day, both of which are bullish indicators. On Wednesday, the stock was able to pop up above the 50-day simple moving average as well, which indicates longer-term sentiment is now bullish.
Bulls want to see Alphabet trade sideways in consolidation to demonstrate stability or for the stock to drop and fill the gap, which could provide a solid entry to go long into the stock split. If either scenario plays out, the stock could be in for a blue sky run. Alphabet has resistance 2,992.10 and $3,037.
Bears want to see big bearish volume knock Alphabet down into the gap and then for continued bearish moment to push the stock down below $2,494, which would indicate Wednesday’s move was a bull trap and the stock will continue in its downtrend. There is support below at $2,884.45 and $2,834.83.
Declinazione di responsabilità
Le informazioni ed i contenuti pubblicati non costituiscono in alcun modo una sollecitazione ad investire o ad operare nei mercati finanziari. Non sono inoltre fornite o supportate da TradingView. Maggiori dettagli nelle Condizioni d'uso.
Declinazione di responsabilità
Le informazioni ed i contenuti pubblicati non costituiscono in alcun modo una sollecitazione ad investire o ad operare nei mercati finanziari. Non sono inoltre fornite o supportate da TradingView. Maggiori dettagli nelle Condizioni d'uso.