#HCL Technologies Limited - Technical Analysis
Price: 1,683.00 |
#Trade Setup - Bullish Reversal
#Outlook
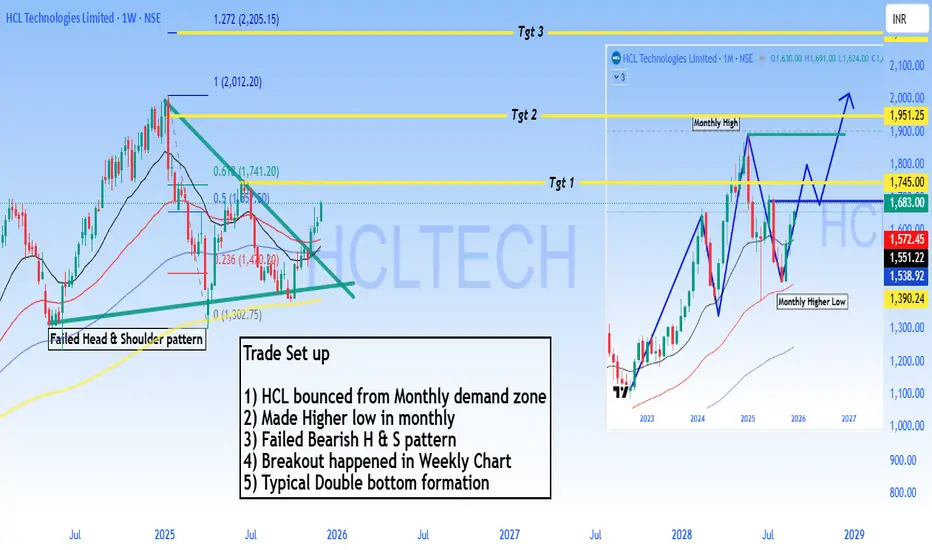
Strong bullish setup with 4-35% upside potential. The failed bearish head & shoulder pattern combined with monthly demand zone bounce suggests institutional accumulation. Breakout above 1,745 opens path to 1,951 and beyond.
Pattern Analysis:
1. Bounced from monthly demand zone - Strong support established
2. Made higher low in monthly chart - Trend reversal signal
3. Failed Bearish Head & Shoulders pattern - Bears trapped, bullish continuation
4. Breakout confirmed on weekly chart - Momentum shift
5. Typical double bottom formation - Classic reversal pattern
Technical Structure:
- Monthly higher low at 1,390 confirms bullish structure
- Failed H&S pattern invalidation is highly bullish
- Price now targeting previous resistance zones
Target Levels:
- Target 1: 1,745.00
- Target 2: 1,951.25
- Target 3: 2,272.70
Support: 1,572 - 1,551 (critical zone)
⚠️ DISCLAIMER
**NOT investment advice.** Educational analysis only. Trading involves substantial risk of loss. Past patterns don't guarantee future results. Always do your own research and consult a SEBI-registered financial advisor. Author assumes no responsibility for losses.
#HCLTech #StockMarket #NSE #TechnicalAnalysis #ITStocks #IndianStockMarket #SwingTrading #Trading #FinTwit #TradingView #ChartAnalysis #StocksToWatch #Nifty50 #TechStocks
Price: 1,683.00 |
#Trade Setup - Bullish Reversal
#Outlook
Strong bullish setup with 4-35% upside potential. The failed bearish head & shoulder pattern combined with monthly demand zone bounce suggests institutional accumulation. Breakout above 1,745 opens path to 1,951 and beyond.
Pattern Analysis:
1. Bounced from monthly demand zone - Strong support established
2. Made higher low in monthly chart - Trend reversal signal
3. Failed Bearish Head & Shoulders pattern - Bears trapped, bullish continuation
4. Breakout confirmed on weekly chart - Momentum shift
5. Typical double bottom formation - Classic reversal pattern
Technical Structure:
- Monthly higher low at 1,390 confirms bullish structure
- Failed H&S pattern invalidation is highly bullish
- Price now targeting previous resistance zones
Target Levels:
- Target 1: 1,745.00
- Target 2: 1,951.25
- Target 3: 2,272.70
Support: 1,572 - 1,551 (critical zone)
⚠️ DISCLAIMER
**NOT investment advice.** Educational analysis only. Trading involves substantial risk of loss. Past patterns don't guarantee future results. Always do your own research and consult a SEBI-registered financial advisor. Author assumes no responsibility for losses.
#HCLTech #StockMarket #NSE #TechnicalAnalysis #ITStocks #IndianStockMarket #SwingTrading #Trading #FinTwit #TradingView #ChartAnalysis #StocksToWatch #Nifty50 #TechStocks
Pubblicazioni correlate
Declinazione di responsabilità
Le informazioni e le pubblicazioni non sono intese come, e non costituiscono, consulenza o raccomandazioni finanziarie, di investimento, di trading o di altro tipo fornite o approvate da TradingView. Per ulteriori informazioni, consultare i Termini di utilizzo.