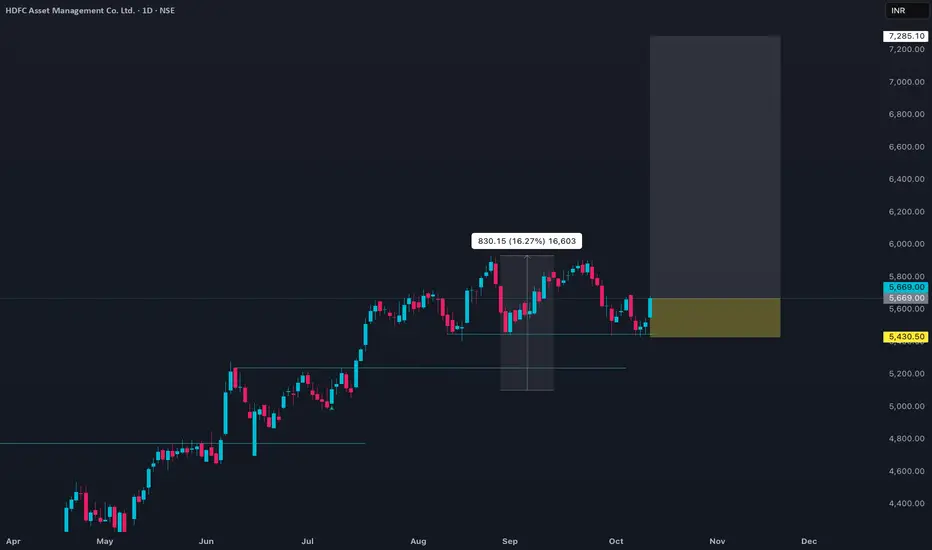
HDFC Asset Management Company Ltd (HDFCAMC) is currently trading around ₹5,669. The stock has recently advanced nearly 2.7% in a single day, with session lows near ₹5,550 and highs close to ₹5,684. Its 52-week range sits between ₹3,525 and ₹5,926, putting the current price near the upper end of its yearly band.
The company’s market capitalization is approximately ₹1,21,300 Crores. Average daily volume is around 12,000 shares, indicating reasonable liquidity for a large-cap stock. The stock holds a trailing P/E ratio of about 47, based on an EPS of ₹121, which is above the broader market average but within the range for premium asset management firms. The dividend yield is around 1.6%. Both 50-day and 200-day averages are close to ₹5,662 and ₹4,717, respectively, illustrating solid medium-term momentum.
Price trends show steady upward bias in 2025, with periodic pullbacks being well-supported and followed by new highs, reflecting investor confidence in HDFC AMC’s market potential, earnings consistency, and recent management initiatives such as a bonus share issue.HDFC Asset Management Company Ltd (HDFCAMC) is currently trading near ₹5,669, showing a strong recent uptrend with prices moving between ₹5,550 and ₹5,684 during the latest session. The 52-week range stands at approximately ₹3,525 to ₹5,926, placing the stock close to its yearly highs.
The company’s market cap is about ₹1,21,000 Crores. Its P/E ratio is around 47 (EPS of ₹121), which reflects a premium over broader market averages but is typical for the asset management sector. Recent daily volumes show consistent interest, and the 50-day and 200-day averages are ₹5,662 and ₹4,717, respectively, confirming a steady upward trend. The dividend yield is close to 1.6%.
Overall price momentum in 2025 remains positive, supported by strong institutional confidence, a track record of earnings growth, and optimism around management initiatives like bonus share announcements.
Pubblicazioni correlate
Declinazione di responsabilità
Le informazioni e le pubblicazioni non sono intese come, e non costituiscono, consulenza o raccomandazioni finanziarie, di investimento, di trading o di altro tipo fornite o approvate da TradingView. Per ulteriori informazioni, consultare i Termini di utilizzo.