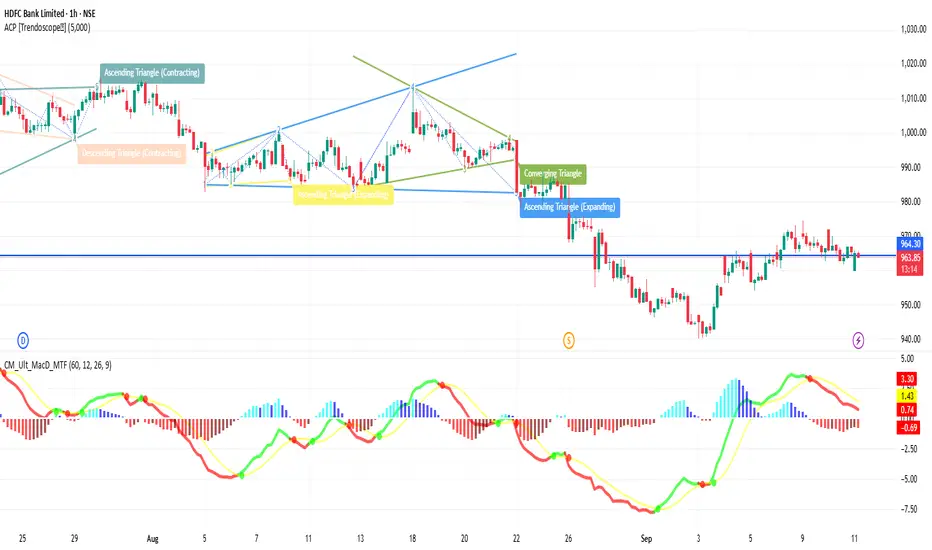
Key Price & Market Info
Current Price: ~ ₹960-965
52-Week Range: ~ ₹806 – ₹1,018
Daily Range (recent): roughly between ₹959 – ₹966
🔎 Technical Indicators & Momentum
RSI (14-hour): ~ 42-45 → Neutral to mildly weak
MACD (hourly estimates): Slightly negative → some bearish pressure
ADX (trend strength): Moderate (~20-25) → trend is present but not very strong
Moving Averages:
Short-term (5-10 hour) MAs seem to be acting as minor resistance/support zones near current price
Mid-term MAs (50-hour) are above the price → resistance upward
Long-term support (200-hour MA) is well below current price → that gives some downside cushion
🔧 Support & Resistance (1-Hour)
Immediate Resistance: ~ ₹970-975
Near Resistance Zone: ~ ₹985-₹990
Support Levels: ~ ₹950-₹955 first, then ~₹940 if weakness increases
🧭 Short-Term Outlook
Bullish Case: If price breaks above ~₹970-975 with volume, upward move toward ~₹985+ might be possible.
Bearish Case: Failing resistance and dropping below ~₹950 might test lower support ~₹940.
Overall Bias: Slightly bearish to neutral—more inclined to expect consolidation or minor pullback unless strong upward catalyst appears.
Pubblicazioni correlate
Declinazione di responsabilità
Le informazioni e le pubblicazioni non sono intese come, e non costituiscono, consulenza o raccomandazioni finanziarie, di investimento, di trading o di altro tipo fornite o approvate da TradingView. Per ulteriori informazioni, consultare i Termini di utilizzo.