📊 HINDUSTAN ZINC LTD (HINDZINC) – NSE | Daily Chart Analysis
📅 Date: May 30, 2025
📈 CMP: ₹464.75 (+2.68%)
📌 Ticker: NSE:HINDZINC
🧠 Technical Breakdown
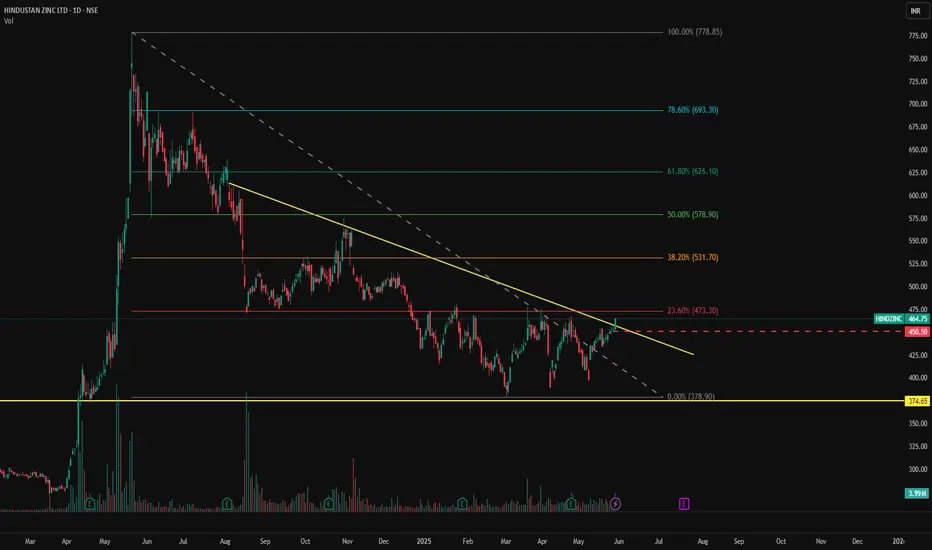
🟢 Descending Trendline Breakout 🟢
The stock is showing early signs of strength as it approaches the apex of a long-term descending trendline. Price action is attempting a trendline breakout from a nearly year-long downtrend, suggesting the possibility of a bullish reversal.
🔍 Volume Confirmation
Steady volume buildup over the past few sessions, potentially indicating accumulation ahead of a confirmed breakout.
📉 Well-Defined Support
₹374.65 has acted as a strong demand zone on multiple occasions, offering a solid base for the current move.
📍 Key Price Levels
🔺 Resistance (Trendline Breakout Zone): ₹465
🔻 Major Support: ₹374.65
🎯 Upside Targets (on breakout):
₹500
₹535
₹575+
🛡️ Stop Loss: Below ₹440 (on breakout failure)
📌 Trading Strategy
Aggressive Entry: On breakout + closing above ₹465 with volume surge
Conservative Entry: Retest of trendline post-breakout
SL: ₹440
Target Zone: ₹500–₹575
⚠️ Disclaimer
This post is for educational purposes only and does not constitute financial advice. Always conduct your own analysis or consult a financial advisor before investing.
📅 Date: May 30, 2025
📈 CMP: ₹464.75 (+2.68%)
📌 Ticker: NSE:HINDZINC
🧠 Technical Breakdown
🟢 Descending Trendline Breakout 🟢
The stock is showing early signs of strength as it approaches the apex of a long-term descending trendline. Price action is attempting a trendline breakout from a nearly year-long downtrend, suggesting the possibility of a bullish reversal.
🔍 Volume Confirmation
Steady volume buildup over the past few sessions, potentially indicating accumulation ahead of a confirmed breakout.
📉 Well-Defined Support
₹374.65 has acted as a strong demand zone on multiple occasions, offering a solid base for the current move.
📍 Key Price Levels
🔺 Resistance (Trendline Breakout Zone): ₹465
🔻 Major Support: ₹374.65
🎯 Upside Targets (on breakout):
₹500
₹535
₹575+
🛡️ Stop Loss: Below ₹440 (on breakout failure)
📌 Trading Strategy
Aggressive Entry: On breakout + closing above ₹465 with volume surge
Conservative Entry: Retest of trendline post-breakout
SL: ₹440
Target Zone: ₹500–₹575
⚠️ Disclaimer
This post is for educational purposes only and does not constitute financial advice. Always conduct your own analysis or consult a financial advisor before investing.
Trade chiuso: obiettivo raggiunto
The first resistance level has been touched. If the trend is to continue, it's important to follow a trailing stop-loss strategy and patiently wait for the price to approach the second resistance level.Declinazione di responsabilità
Le informazioni ed i contenuti pubblicati non costituiscono in alcun modo una sollecitazione ad investire o ad operare nei mercati finanziari. Non sono inoltre fornite o supportate da TradingView. Maggiori dettagli nelle Condizioni d'uso.
Declinazione di responsabilità
Le informazioni ed i contenuti pubblicati non costituiscono in alcun modo una sollecitazione ad investire o ad operare nei mercati finanziari. Non sono inoltre fornite o supportate da TradingView. Maggiori dettagli nelle Condizioni d'uso.