Technical Overview:
Overall Signal: Strong Buy
Moving Averages: All moving averages (5, 10, 20, 50, 100, 200) are indicating a Buy signal.
RSI (14): 90.29 – Overbought (indicates strong upward momentum)
MACD: 24.38 – Positive (supports bullish trend)
Stochastic RSI: 95.20 – Overbought (suggests potential for a pullback)
CCI (14): 194.96 – Positive (indicates strong trend strength)
ADX (14): 35.55 – Strong trend (above 25 indicates a strong trend)
ATR (14): 14.44 – High volatility (indicates significant price movement)
Pivot Points:
Resistance Levels: R1: ₹565.46, R2: ₹570.23, R3: ₹577.96
Support Levels: S1: ₹552.96, S2: ₹545.23, S3: ₹540.46
Price Action:
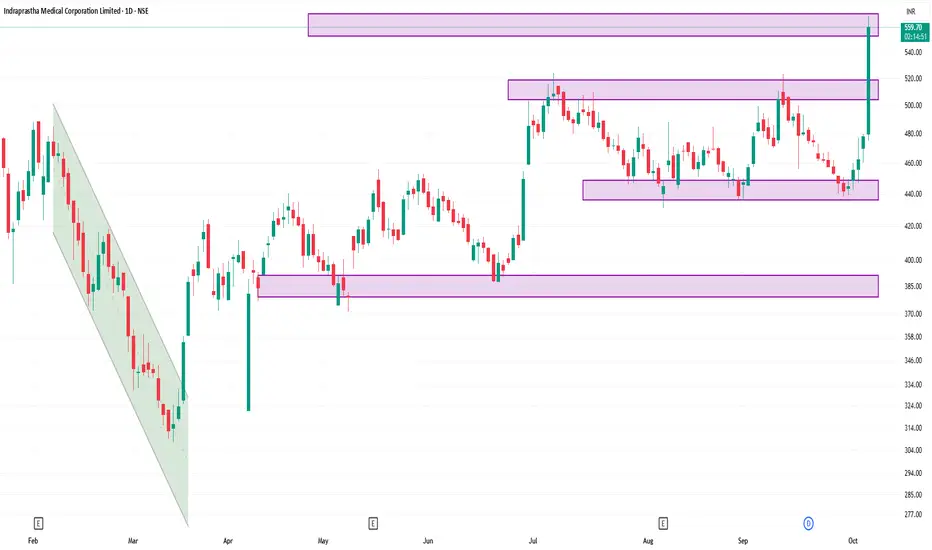
Current Price: ₹559.50
Day Range: ₹475.00 – ₹568.90
Previous Close: ₹478.10
Volume: Approximately 4.5 million shares traded
VWAP: ₹541.59
52-Week High/Low: ₹572.00 / ₹307.25
Summary:
The stock is currently trading near its 52-week high, indicating strong investor confidence. Technical indicators suggest a robust bullish trend, though the overbought conditions (RSI and Stochastic RSI) may imply a potential short-term pullback. Traders should monitor for any signs of reversal or consolidation near resistance levels.
Overall Signal: Strong Buy
Moving Averages: All moving averages (5, 10, 20, 50, 100, 200) are indicating a Buy signal.
RSI (14): 90.29 – Overbought (indicates strong upward momentum)
MACD: 24.38 – Positive (supports bullish trend)
Stochastic RSI: 95.20 – Overbought (suggests potential for a pullback)
CCI (14): 194.96 – Positive (indicates strong trend strength)
ADX (14): 35.55 – Strong trend (above 25 indicates a strong trend)
ATR (14): 14.44 – High volatility (indicates significant price movement)
Pivot Points:
Resistance Levels: R1: ₹565.46, R2: ₹570.23, R3: ₹577.96
Support Levels: S1: ₹552.96, S2: ₹545.23, S3: ₹540.46
Price Action:
Current Price: ₹559.50
Day Range: ₹475.00 – ₹568.90
Previous Close: ₹478.10
Volume: Approximately 4.5 million shares traded
VWAP: ₹541.59
52-Week High/Low: ₹572.00 / ₹307.25
Summary:
The stock is currently trading near its 52-week high, indicating strong investor confidence. Technical indicators suggest a robust bullish trend, though the overbought conditions (RSI and Stochastic RSI) may imply a potential short-term pullback. Traders should monitor for any signs of reversal or consolidation near resistance levels.
Pubblicazioni correlate
Declinazione di responsabilità
Le informazioni e le pubblicazioni non sono intese come, e non costituiscono, consulenza o raccomandazioni finanziarie, di investimento, di trading o di altro tipo fornite o approvate da TradingView. Per ulteriori informazioni, consultare i Termini di utilizzo.