Current Facts
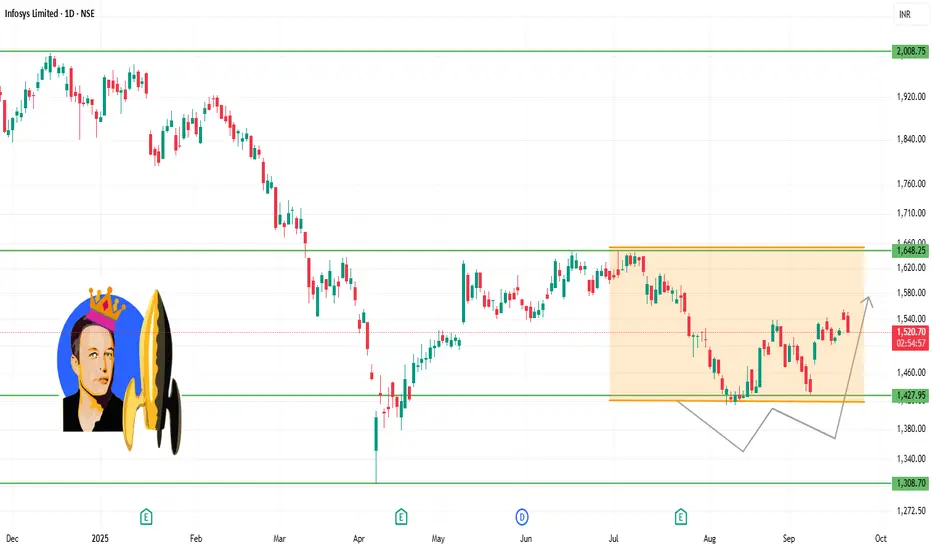
INFY is trading around ₹1,525-₹1,530.
Recent high / resistance being tested around ₹1,540-₹1,550.
The stock has a 52-week low around ₹1,307 and a high near ₹2,006.
Technical momentum is neutral to mildly bullish. Indicators like MACD are positive but RSI is not yet overbought.
🔍 Key Support & Resistance Levels
Immediate Support: ~ ₹1,500-₹1,510 — this is the level to watch closely. If INFY remains above this, it helps maintain bullish bias.
Secondary Support: ~ ₹1,470-₹1,490, in case the nearer support fails.
Immediate Resistance: ~ ₹1,540-₹1,550 — price is facing supply pressure here.
Stronger Resistance: ~ ₹1,560-₹1,570 if INFY manages to break above the nearer resistance.
⚙️ Interpretation & Outlook
As long as INFY stays above the ~₹1,500 support, bulls have a chance to push toward resistance.
Selling pressure is visible near the resistance zone; repeated failures at that zone could lead to consolidation or a pullback.
If INFY breaks above ₹1,550 with strong volume, the upside may extend toward ~₹1,560-₹1,570 and beyond.
⚠️ Risk Points
Breakdown below ₹1,500 may drag INFY toward the ~₹1,470-₹1,490 support.
If that too fails, deeper weakness may set in, possibly toward lower zones depending on market sentiment.
Pubblicazioni correlate
Declinazione di responsabilità
The information and publications are not meant to be, and do not constitute, financial, investment, trading, or other types of advice or recommendations supplied or endorsed by TradingView. Read more in the Terms of Use.
Pubblicazioni correlate
Declinazione di responsabilità
The information and publications are not meant to be, and do not constitute, financial, investment, trading, or other types of advice or recommendations supplied or endorsed by TradingView. Read more in the Terms of Use.