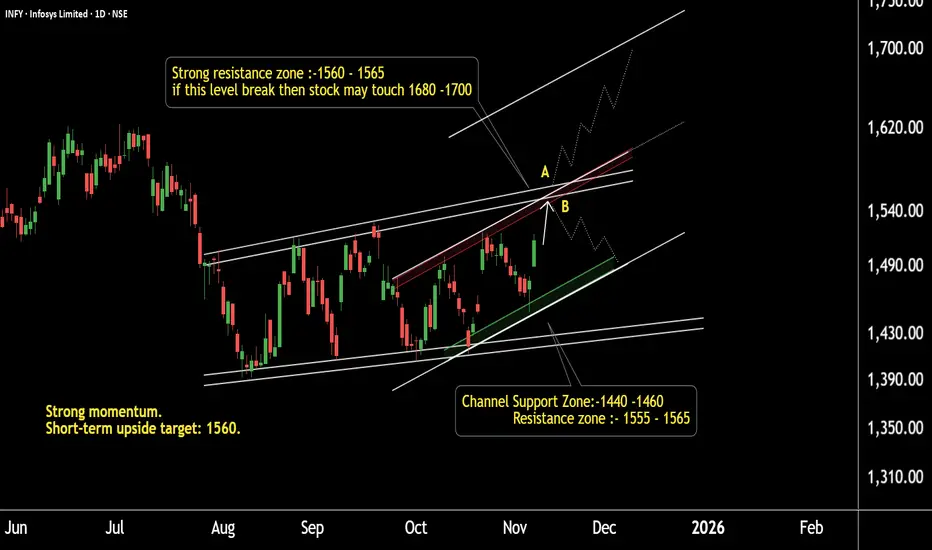
This is the daily timeframe chart of INFY.
The stock has a strong support zone near 1410 and 1440.
It is facing major resistance within the short-term and mid-term channel around 1555–1565.
Currently, INFY is trading near 1520, and the ongoing move may extend toward 1560.
If the stock fails to break this resistance, a short-term decline may occur.
However, if the resistance is decisively broken, INFY has the potential to rally toward 1680–1700 based on the channel trend.
Thank You !!
@RahulSaraoge
Connect us at t.me/stridesadvisory
Connect us at t.me/stridesadvisory
Declinazione di responsabilità
Le informazioni e le pubblicazioni non sono intese come, e non costituiscono, consulenza o raccomandazioni finanziarie, di investimento, di trading o di altro tipo fornite o approvate da TradingView. Per ulteriori informazioni, consultare i Termini di utilizzo.