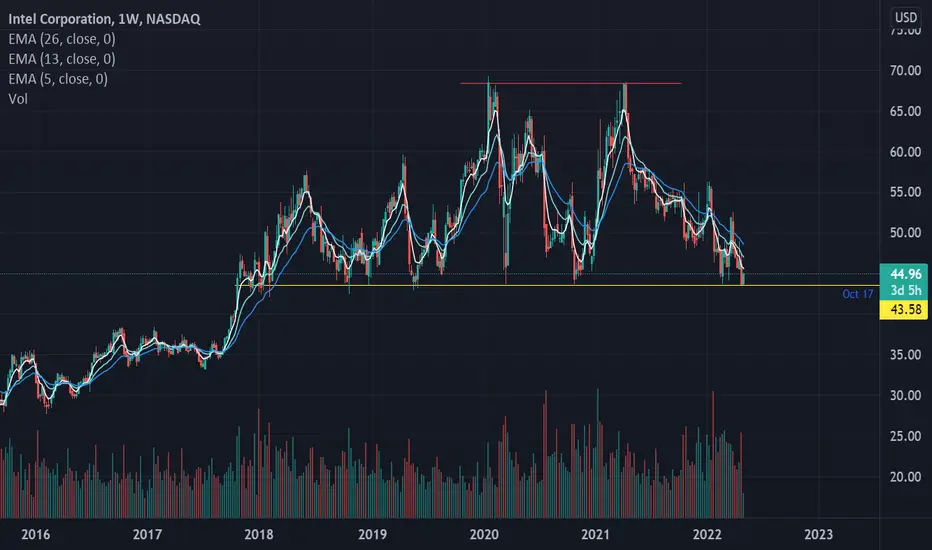
After making a double top pattern in April 21, Intel Corp is trading exactly at its support of 43.6. Looking at the overall chart and trend, it appears that Intel should break this support soon. Whenever the price touches support/ resistance it makes it weak and in this case, price is taking support @ 43.5 from last several years. Breakdown of this support means over the period of 3 years the distribution is completed and the stock is moved from stronger hands to weaker hands. This could also mean that the stock should go in down trend in medium to long term. Keep this stock in your watch list to make good profits!
Nota
Breakdown. Next target 33.5Declinazione di responsabilità
Le informazioni ed i contenuti pubblicati non costituiscono in alcun modo una sollecitazione ad investire o ad operare nei mercati finanziari. Non sono inoltre fornite o supportate da TradingView. Maggiori dettagli nelle Condizioni d'uso.
Declinazione di responsabilità
Le informazioni ed i contenuti pubblicati non costituiscono in alcun modo una sollecitazione ad investire o ad operare nei mercati finanziari. Non sono inoltre fornite o supportate da TradingView. Maggiori dettagli nelle Condizioni d'uso.