📌 To see my confluences and/or linework: Step 1: Grab chart 📊, Step 2: Unhide Group 1 in object tree 🌲, Step 3: Hide and unhide specific confluences one by one ✨. Also, double-click the screen to show RSI, MFI, CVD, and OBV indicators alongside divergence markings! 🎯
⚔️ The Market Participant Battle:
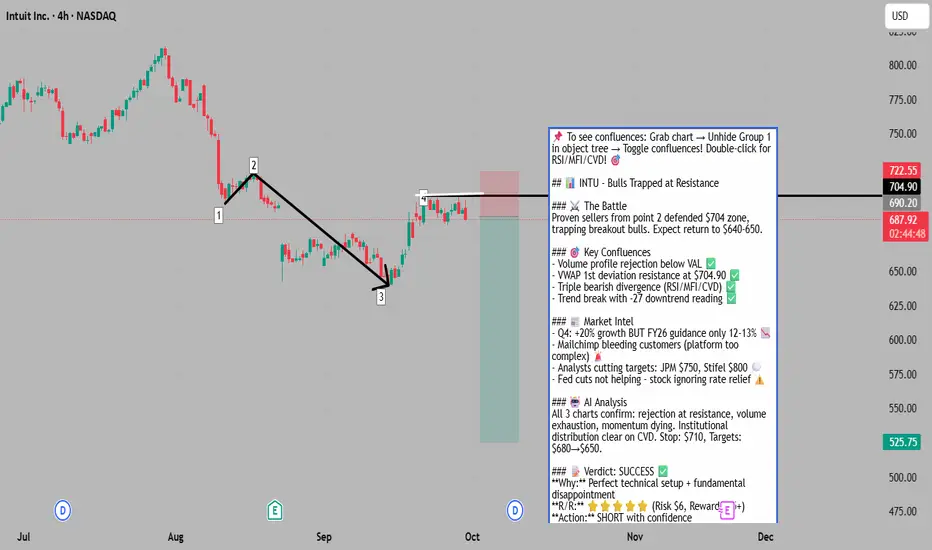
The proven sellers at point 2 have successfully defended their territory, trapping aggressive bulls who attempted a breakout. With price returning to this battleground at point 4, these sellers have reasserted dominance, closing below critical volume supports. Bears have cornered bulls at the upper VWAP deviation, setting up a return move targeting the $640-650 zone where trapped longs will liquidate.
🔍 Confluences:
Confluence 1: Volume Profile Rejection & VWAP Resistance
The rejection from the value area low-high zone represents a critical failure for bulls. Price closed below the volume area low of the major 1->3 swing, confirming sellers' control. The VWAP from point 1 shows point 4 rejecting precisely at the 1st standard deviation ($704.90), a textbook reversal signal. The anchored volume profile reveals the current candle closing below the developing POC, suggesting further downside acceleration.
Confluence 2: Triple Bearish Divergence Complex
RSI, MFI, and CVD all display synchronized bearish divergences at point 4. The RSI sits at 34.58, already in oversold territory but with room to fall further. MFI at 29.82 confirms money flow exhaustion. Most critically, the CVD (Cumulative Volume Delta) shows declining buyer participation despite price attempts higher - institutional distribution in action.
Confluence 3: Trend Line Break & Downtrend Confirmation
The TLPv27.1 indicator shows a strong downtrend reading of 706.82 with 2.77% distance to target. The green uptrend line has been decisively broken, with price now below both the 50-bar (showing -27 downtrend) and 100-bar (showing -19 downtrend) trend readings. The 200-bar remains sideways, suggesting this is still an intermediate correction within a larger range.
📰 Web Research Findings:
- Technical Analysis: INTU technical indicators show a Strong Sell position with 0 buy signals and 8 sell signals, RSI at 30.704 suggesting oversold conditions
- Recent News/Earnings: Q4 2025 revenue grew 20% but fiscal 2026 guidance of 12-13% growth disappointed versus 16% in fiscal 2025
- Analyst Sentiment: Despite 18 buy ratings, recent price target cuts from Stifel ($800), JPMorgan ($750) reflect growing caution
- Mailchimp Weakness: Mailchimp revenue declined in Q4, with CFO calling it a "near-term drag" due to platform complexity hurting retention
- Interest Rate Impact: Fed cut rates by 0.25% with two more cuts expected in 2025, historically benefiting growth stocks but INTU hasn't responded positively
💡 Layman's Summary:
Think of INTU like a high-flying restaurant that just disappointed investors. While they served 20% more meals last quarter (great!), they warned next year they'll only grow by 12-13% (not so great). Their newly acquired food delivery service (Mailchimp) is losing customers because the app is too complicated. Even though interest rates are dropping (usually good for tech stocks), investors are selling first and asking questions later. The stock has fallen from $813 to current levels and technical signals scream "danger ahead."
🤖 Machine Derived Information:
- Image 1: 4-hour chart showing points 1-4 pattern with Bollinger Bands - Significance: Clear rejection from upper band at point 4, confirming resistance - AGREES ✔
- Image 2: 4-hour chart with trend strength indicators - Significance: Downtrend confirmed across multiple timeframes, strong bearish momentum - AGREES ✔
- Image 3: 4-hour chart with volume indicators - Significance: RSI/MFI/CVD triple divergence pattern, institutional distribution evident - AGREES ✔
🎯 Actionable Machine Summary:
All three charts confirm the bearish setup. The volume profile rejection combined with VWAP resistance creates a high-probability short entry. The triple divergence on momentum indicators suggests exhausted buying pressure. Trend indicators unanimously point lower. Risk/reward favors shorts with stop above $710 and targets at $680 (first) and $650 (final).
📊 Conclusion:
Trade Prediction: SUCCESS ✅
Confidence: High
The confluence of technical rejection at proven resistance, bearish divergences across multiple indicators, disappointing forward guidance, and Mailchimp headwinds creates an compelling short setup. While INTU remains a quality company long-term, the near-term technical and fundamental picture strongly favors the bears. The 1->4 pattern completion at VWAP resistance with volume confirmation provides an excellent risk/reward short entry.
⚔️ The Market Participant Battle:
The proven sellers at point 2 have successfully defended their territory, trapping aggressive bulls who attempted a breakout. With price returning to this battleground at point 4, these sellers have reasserted dominance, closing below critical volume supports. Bears have cornered bulls at the upper VWAP deviation, setting up a return move targeting the $640-650 zone where trapped longs will liquidate.
🔍 Confluences:
Confluence 1: Volume Profile Rejection & VWAP Resistance
The rejection from the value area low-high zone represents a critical failure for bulls. Price closed below the volume area low of the major 1->3 swing, confirming sellers' control. The VWAP from point 1 shows point 4 rejecting precisely at the 1st standard deviation ($704.90), a textbook reversal signal. The anchored volume profile reveals the current candle closing below the developing POC, suggesting further downside acceleration.
Confluence 2: Triple Bearish Divergence Complex
RSI, MFI, and CVD all display synchronized bearish divergences at point 4. The RSI sits at 34.58, already in oversold territory but with room to fall further. MFI at 29.82 confirms money flow exhaustion. Most critically, the CVD (Cumulative Volume Delta) shows declining buyer participation despite price attempts higher - institutional distribution in action.
Confluence 3: Trend Line Break & Downtrend Confirmation
The TLPv27.1 indicator shows a strong downtrend reading of 706.82 with 2.77% distance to target. The green uptrend line has been decisively broken, with price now below both the 50-bar (showing -27 downtrend) and 100-bar (showing -19 downtrend) trend readings. The 200-bar remains sideways, suggesting this is still an intermediate correction within a larger range.
📰 Web Research Findings:
- Technical Analysis: INTU technical indicators show a Strong Sell position with 0 buy signals and 8 sell signals, RSI at 30.704 suggesting oversold conditions
- Recent News/Earnings: Q4 2025 revenue grew 20% but fiscal 2026 guidance of 12-13% growth disappointed versus 16% in fiscal 2025
- Analyst Sentiment: Despite 18 buy ratings, recent price target cuts from Stifel ($800), JPMorgan ($750) reflect growing caution
- Mailchimp Weakness: Mailchimp revenue declined in Q4, with CFO calling it a "near-term drag" due to platform complexity hurting retention
- Interest Rate Impact: Fed cut rates by 0.25% with two more cuts expected in 2025, historically benefiting growth stocks but INTU hasn't responded positively
💡 Layman's Summary:
Think of INTU like a high-flying restaurant that just disappointed investors. While they served 20% more meals last quarter (great!), they warned next year they'll only grow by 12-13% (not so great). Their newly acquired food delivery service (Mailchimp) is losing customers because the app is too complicated. Even though interest rates are dropping (usually good for tech stocks), investors are selling first and asking questions later. The stock has fallen from $813 to current levels and technical signals scream "danger ahead."
🤖 Machine Derived Information:
- Image 1: 4-hour chart showing points 1-4 pattern with Bollinger Bands - Significance: Clear rejection from upper band at point 4, confirming resistance - AGREES ✔
- Image 2: 4-hour chart with trend strength indicators - Significance: Downtrend confirmed across multiple timeframes, strong bearish momentum - AGREES ✔
- Image 3: 4-hour chart with volume indicators - Significance: RSI/MFI/CVD triple divergence pattern, institutional distribution evident - AGREES ✔
🎯 Actionable Machine Summary:
All three charts confirm the bearish setup. The volume profile rejection combined with VWAP resistance creates a high-probability short entry. The triple divergence on momentum indicators suggests exhausted buying pressure. Trend indicators unanimously point lower. Risk/reward favors shorts with stop above $710 and targets at $680 (first) and $650 (final).
📊 Conclusion:
Trade Prediction: SUCCESS ✅
Confidence: High
The confluence of technical rejection at proven resistance, bearish divergences across multiple indicators, disappointing forward guidance, and Mailchimp headwinds creates an compelling short setup. While INTU remains a quality company long-term, the near-term technical and fundamental picture strongly favors the bears. The 1->4 pattern completion at VWAP resistance with volume confirmation provides an excellent risk/reward short entry.
for trading mentorship and community, message me on telegram : jacesabr_real
Declinazione di responsabilità
Le informazioni ed i contenuti pubblicati non costituiscono in alcun modo una sollecitazione ad investire o ad operare nei mercati finanziari. Non sono inoltre fornite o supportate da TradingView. Maggiori dettagli nelle Condizioni d'uso.