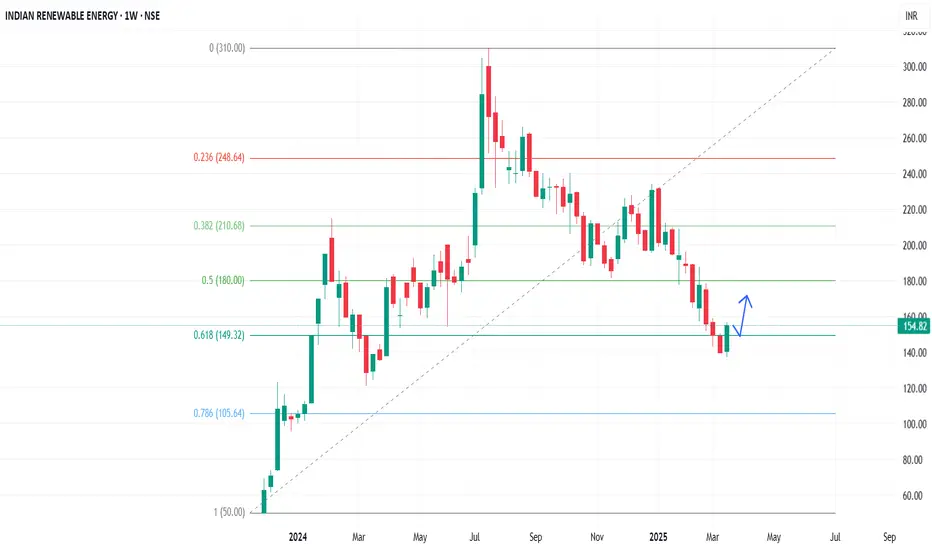
In the Weekly Chart of IREDA ,
we can see that; it a given a comeback from last FIBO level of support after crossing it.
Let it create a Halt candle and take support of FIBO level and then we can see the continuity in momentum.
we can see that; it a given a comeback from last FIBO level of support after crossing it.
Let it create a Halt candle and take support of FIBO level and then we can see the continuity in momentum.
Declinazione di responsabilità
Le informazioni e le pubblicazioni non sono intese come, e non costituiscono, consulenza o raccomandazioni finanziarie, di investimento, di trading o di altro tipo fornite o approvate da TradingView. Per ulteriori informazioni, consultare i Termini di utilizzo.
Declinazione di responsabilità
Le informazioni e le pubblicazioni non sono intese come, e non costituiscono, consulenza o raccomandazioni finanziarie, di investimento, di trading o di altro tipo fornite o approvate da TradingView. Per ulteriori informazioni, consultare i Termini di utilizzo.