ITC Chart Update (Weekly & 4H Timeframe)
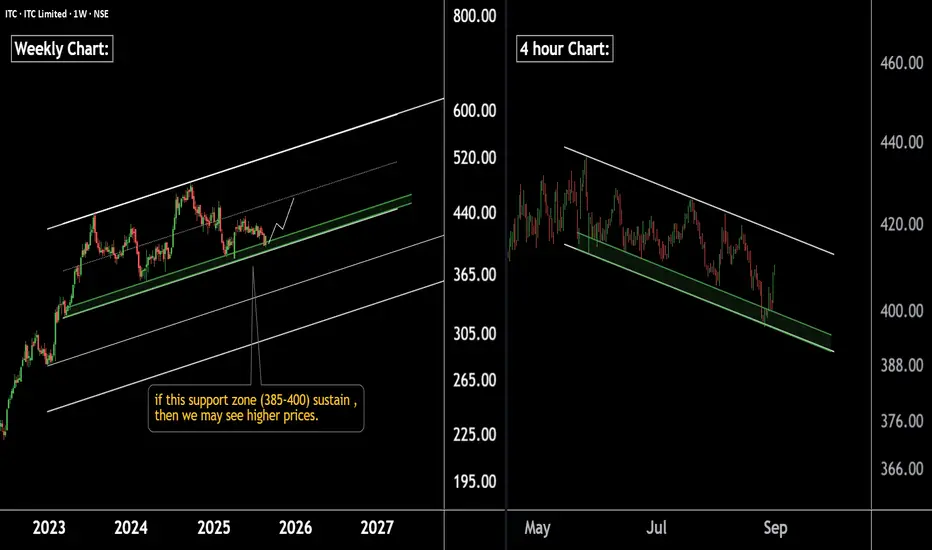
On the weekly chart, ITC is moving within a well-defined parallel channel, with immediate support in the 385–400 zone. A breakdown below this zone could take the stock towards the next strong support near 300.
On the 4-hour chart, ITC is forming a falling channel, with support also placed around the 390–400 zone. If this level holds, we may witness a potential upside move in ITC.
Conclusion: The 390–400 zone will play a decisive role. Sustaining above it may trigger an upward move, while a breakdown could extend weakness towards lower levels.
@RahulSaraoge
Connect us at t.me/stridesadvisory
Connect us at t.me/stridesadvisory
Declinazione di responsabilità
Le informazioni e le pubblicazioni non sono intese come, e non costituiscono, consulenza o raccomandazioni finanziarie, di investimento, di trading o di altro tipo fornite o approvate da TradingView. Per ulteriori informazioni, consultare i Termini di utilizzo.