Summary: The S&P 500 and Dow Jones set new records this week while the Nasdaq struggled with a rotation and indecision from investors. Small caps took a step back while value stocks marched forward.
Notes
The structure is the following:
If you have been following my daily updates, you can skip down to "View on the Week." If not, then this first part is a great play-by-play recap for the week. Click the daily charts for more detail on sectors, indexes, and market leaders each day.
-=x=-=x=-=x=-=x=-=x=-=x=-=x=-
Monday, August 9, 2021

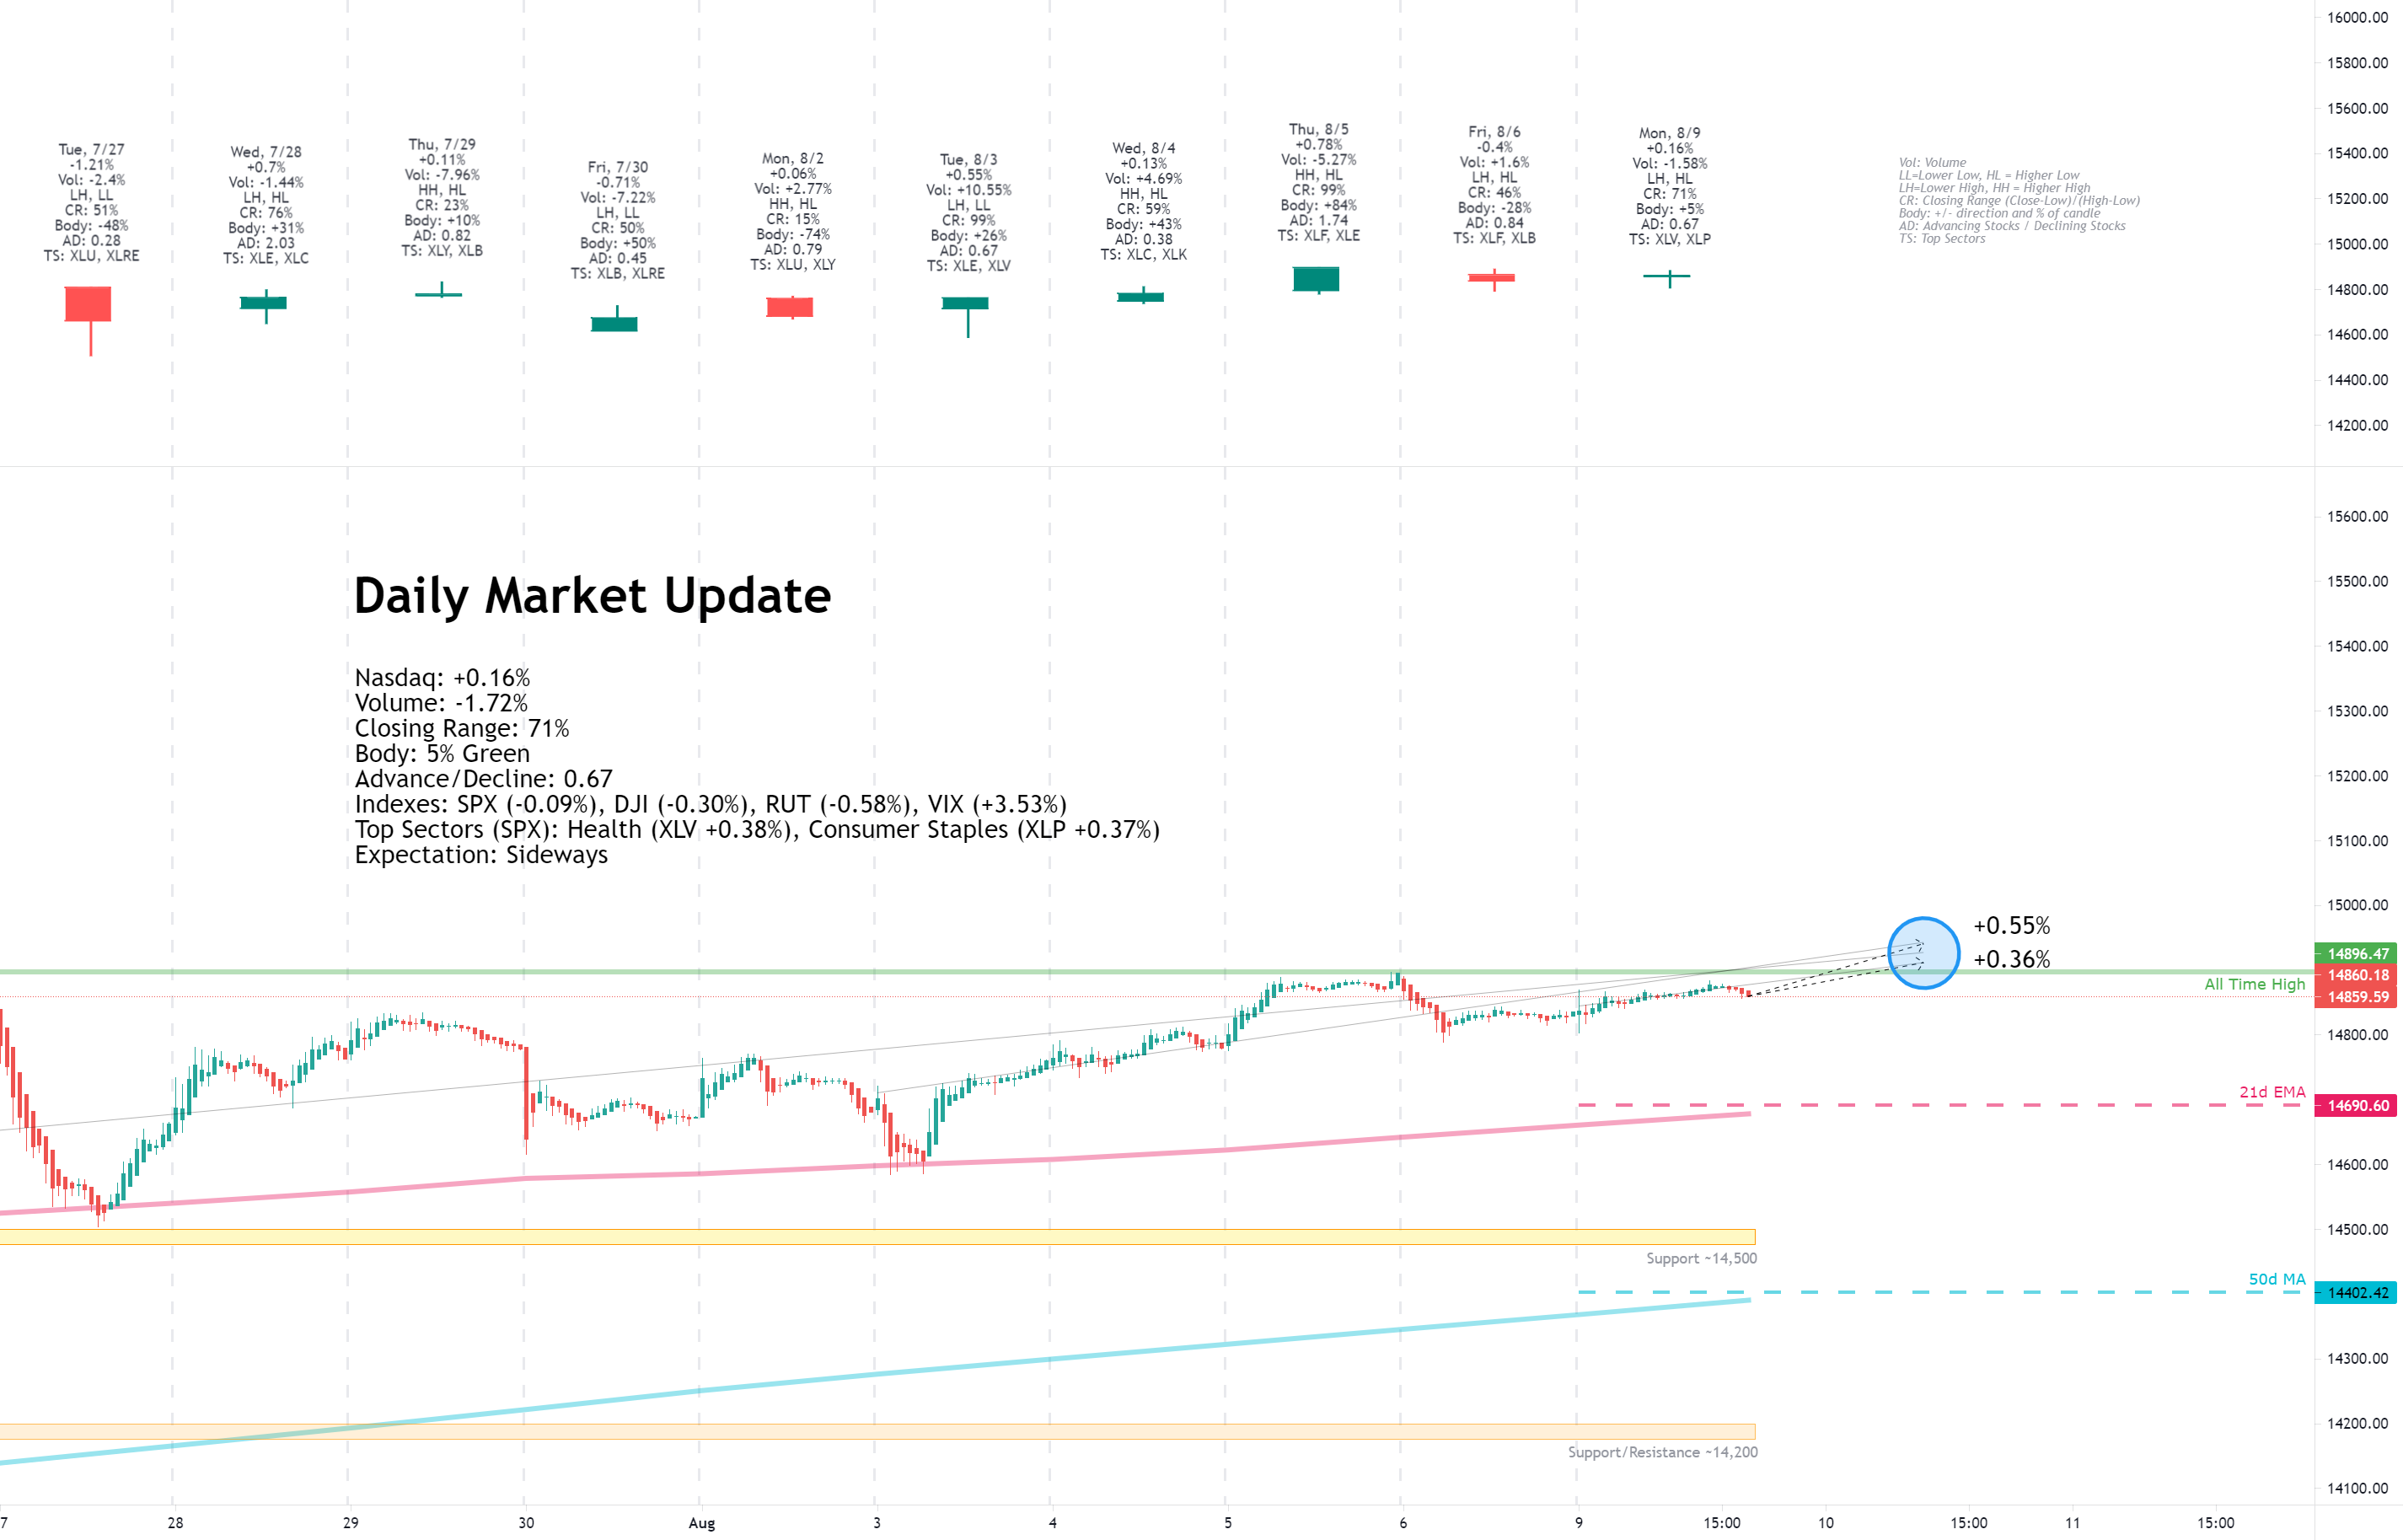
Facts: +0.16%, Volume lower, Closing range: 71%, Body: 5%
Good: Higher low, small gain on otherwise cautious day
Bad: Lower high, indecisive day
Highs/Lows: Lower high, higher low
Candle: Another inside day, indecisive candle with thin body in the upper half
Advanced/Decline: 0.67, three declining stocks for every advancing stock
Indexes: SPX (-0.09%), DJI (-0.30%), RUT (-0.58%), VIX (+3.53%)
Sectors: Health (XLV +0.38%) and Consumer Staples (XLP +0.37%) at the top. Real Estate (XLRE -0.45%) and Energy (XLY -1.41%) at the bottom.
Expectation: Sideways
It was another inside day for the Nasdaq as the market entered the week with caution. The Delta variant of the virus continues to rise while strong employment data is turning the Fed toward more tapering discussion. The combination drove the dollar higher and Treasury prices lower.
The Nasdaq ended the day with a small advance, gaining +0.16%. The thin 5% body is in the upper half of the candle which has a lower high and higher high than the previous day. That's the second inside day in a row as the market consolidates before choosing a direction. The closing range of 71% is a positive but there were three declining stocks for every two advancing stocks.
-=x=-=x=-=x=-=x=-=x=-=x=-=x=-
Tuesday, August 10, 2021
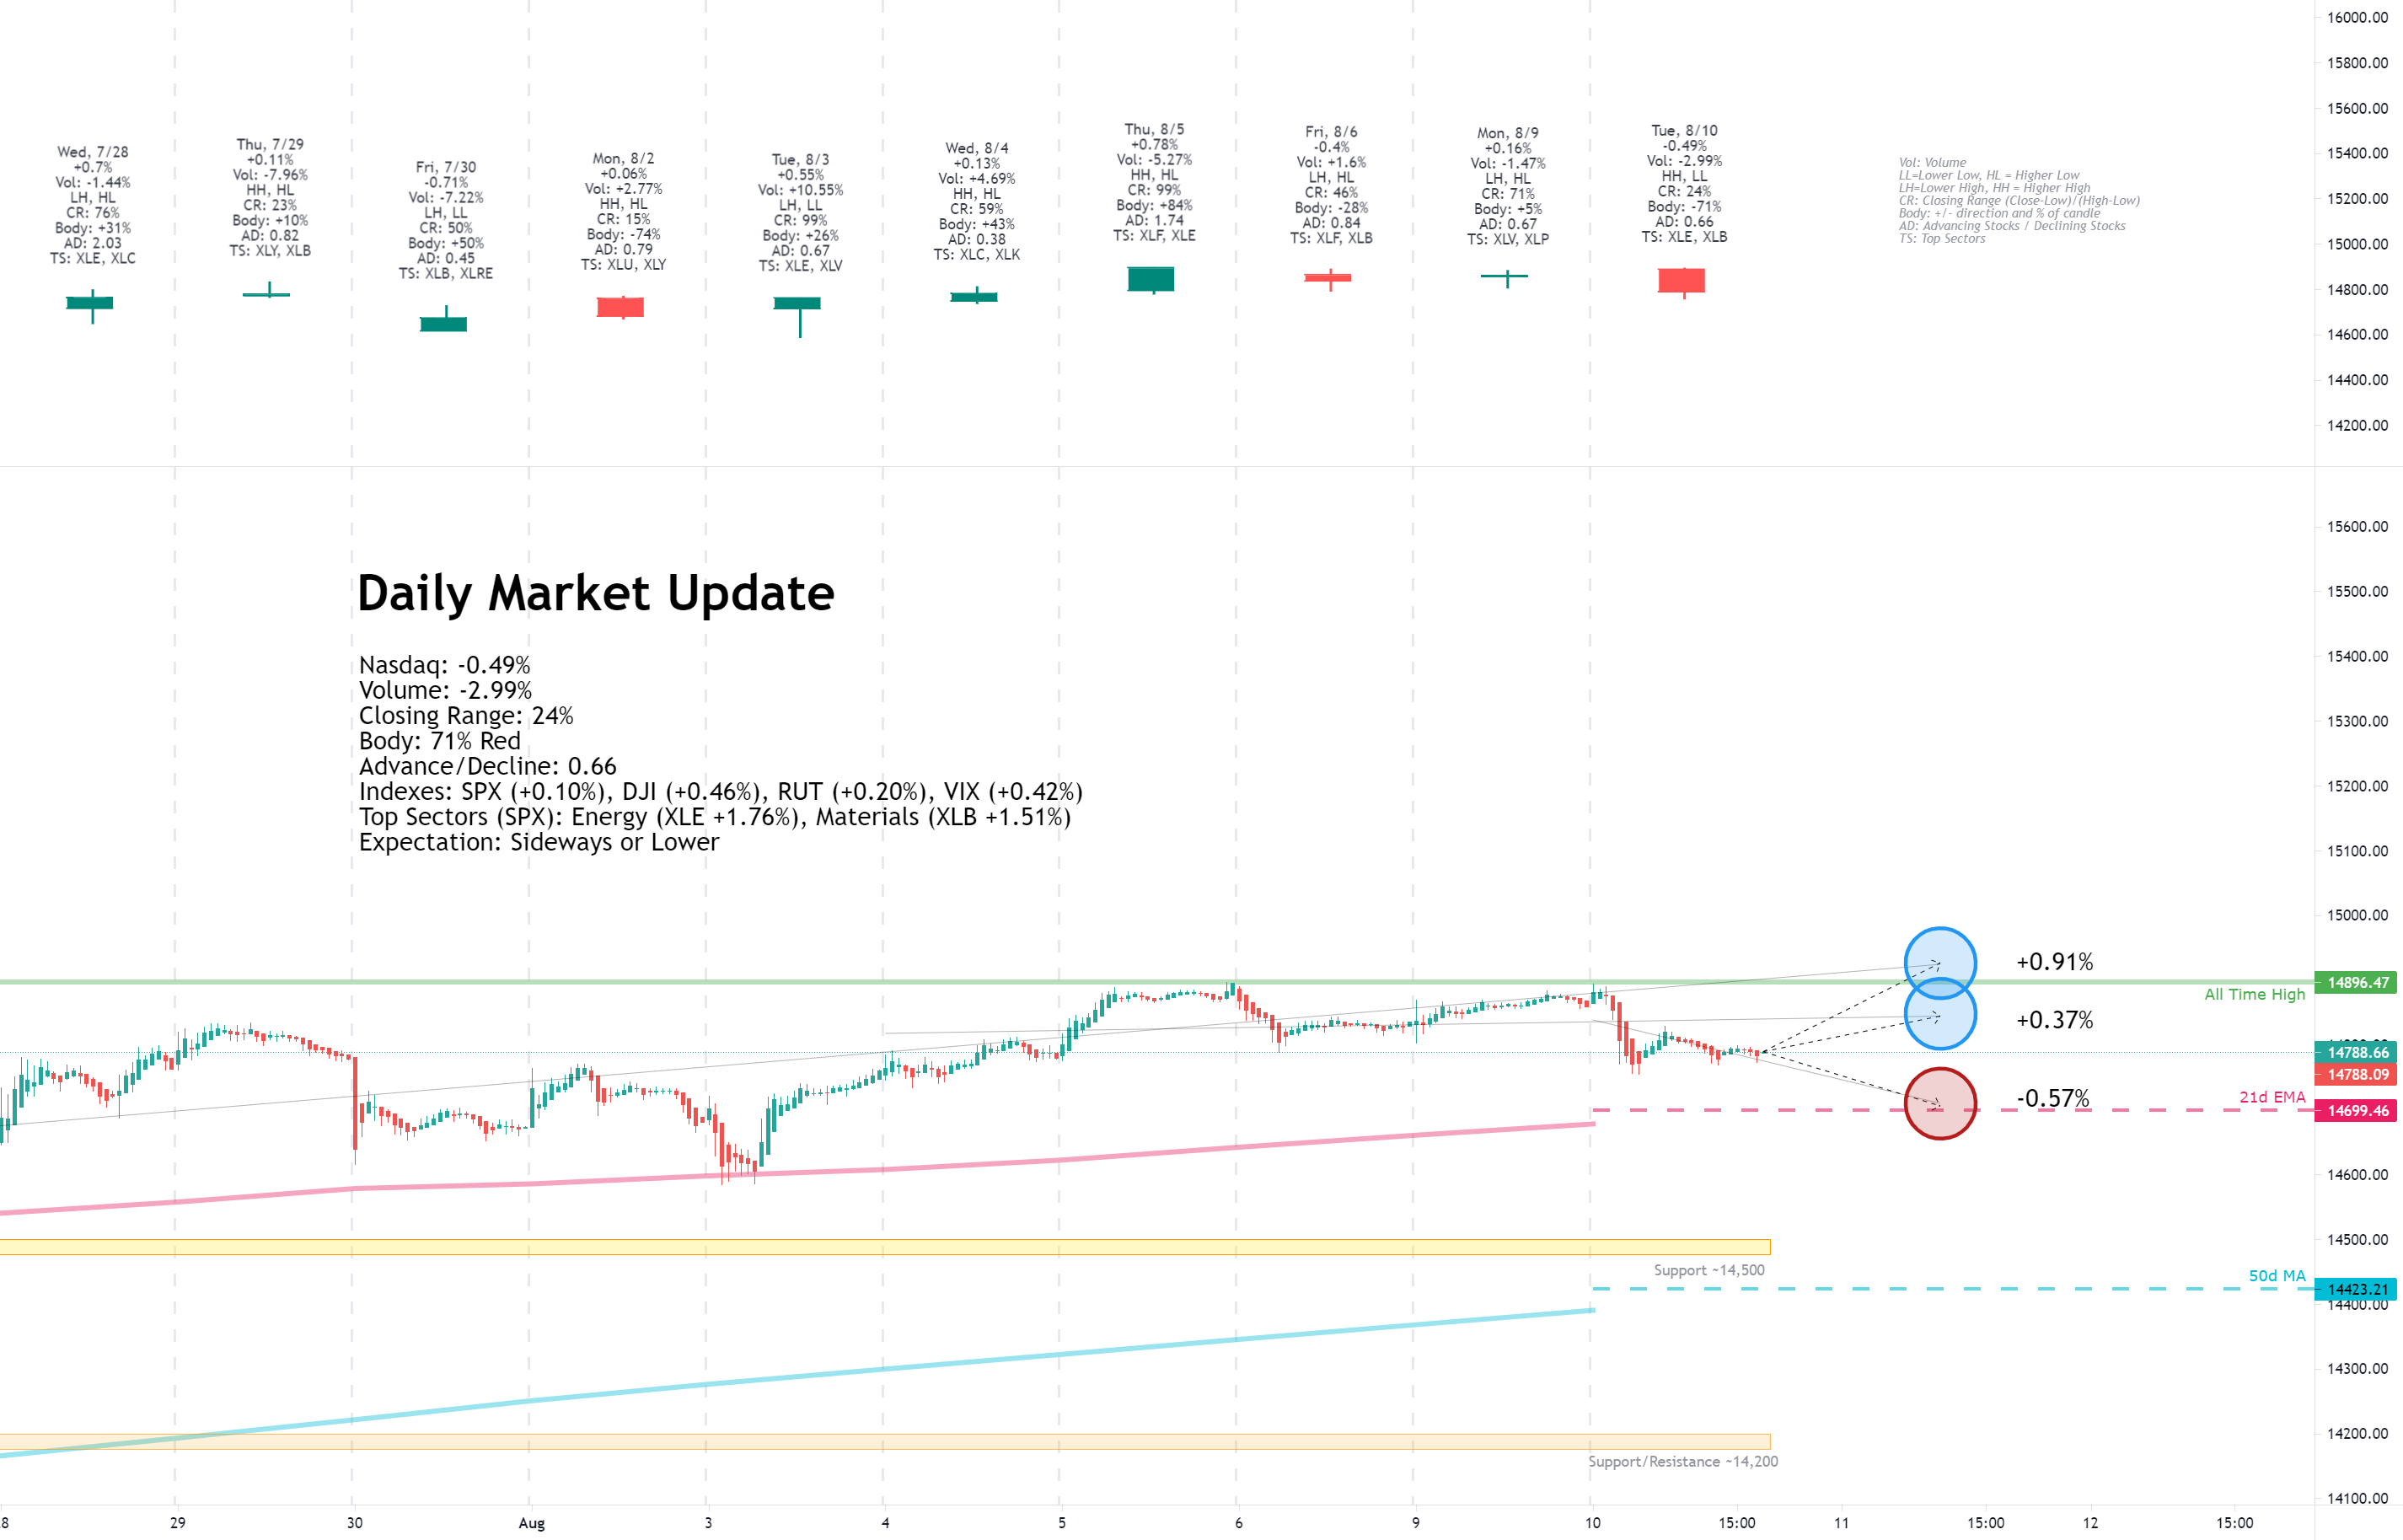
Facts: -0.49%, Volume lower, Closing range: 24%, Body: 71%
Good: Higher high, lower volume on decline
Bad: Lower low, low closing range
Highs/Lows: Higher high, lower low
Candle: Outside day made of mostly selling after the morning high.
Advanced/Decline: 0.66, three declining stocks for every advancing stock
Indexes: SPX (+0.10%), DJI (+0.46%), RUT (+0.20%), VIX (+0.42%)
Sectors: Energy (XLE +1.76%) and Materials (XLB +1.51%) at the top. Technology (XLK -0.72%) and Real Estate (XLRE -1.07%) at the bottom.
Expectation: Sideways or Lower
Value stocks were in the spotlight today after the passing of the infrastructure bill in the Senate initiated a rotation into cyclical sectors. The result was new record closes for the Dow Jones and S&P 500.
The Nasdaq closed with a -0.49% loss for the day. Volume was lower than the previous day. Three stocks declined for every two advancing stocks. The index attempted a rally in the morning but sold off quickly, resulting in a 71% red body and 24% closing range. The lower wick is longer than the upper wick. The higher high and lower low create an outside day following two inside days.
-=x=-=x=-=x=-=x=-=x=-=x=-=x=-
Wednesday, August 11, 2021
Facts: -0.16%, Volume higher, Closing range: 48%, Body: 46%
Good: Support at 21d EMA, rally after support creates longer lower wick
Bad: Lower high, morning selling after hitting intraday high
Highs/Lows: Lower high, lower low
Candle: Red body covers upper half of candle, long lower wick covers lower half.
Advanced/Decline: 0.83, more declining stocks than advancing stocks
Indexes: SPX (+0.25%), DJI (+0.62%), RUT (+0.49%), VIX (-4.35%)
Sectors: Materials (XLB +1.41%) and Industrials (XLI +1.30%) at the top. Technology (XLK +0.01%) and Health (XLV -0.99%) at the bottom.
Expectation: Sideways or Lower
Recovery and value stocks helped send the S&P 500 and Dow Jones to yet another record close on the day after the Infrastructure bill made it through the Senate.
The Nasdaq closed with a loss of -0.16%. Volume was slightly higher than the previous day. The index opened up with a short rally to the intraday high and then sold off through the morning until getting support at the 21d exponential moving average before moving higher. The action created a long lower wick underneath a 46% red body and resulted in a 48% closing range. There were more declining stocks than advancing stocks on the growth-heavy Nasdaq. Beyond the Nasdaq, there were far more advancing stocks than declining stocks in the US markets.
-=x=-=x=-=x=-=x=-=x=-=x=-=x=-
Thursday, August 12, 2021
Facts: +0.35%, Volume higher, Closing range: 94%, Body: 52%
Good: Another test with support at 21d EMA, green body over long lower wick
Bad: Low A/D ratio, lower high
Highs/Lows: Lower high, higher low
Candle: Inside day, green body covers upper half of the candle.
Advanced/Decline: 0.49, two declining stocks for every advancing stock
Indexes: SPX (+0.30%), DJI (+0.04%), RUT (-0.28%), VIX (-3.05%)
Sectors: Health (XLV +0.79%) and Technology (XLK +0.57%) at the top. Materials (XLB -0.16%) and Industrials (XLI -0.10%) at the bottom.
Expectation: Sideways
Jobs data helped boost the markets to more records today with big tech helping lead the way higher. The S&P 500 and Dow Jones Industrial Average both closed at record highs for the third day in a row.
The Nasdaq finished the day with a +0.35% gain on slightly higher volume than the previous day. The index declined after open but found support at the 21d exponential moving average line and moved higher the rest of the day. The 52% green body covers the upper half of the candle. The rally in the afternoon resulted in a 94% closing range. A lower high and higher low, marks another inside day for the Nasdaq. There were two declining stocks for every advancing stock.
-=x=-=x=-=x=-=x=-=x=-=x=-=x=-
Friday, August 13, 2021
Facts: +0.04%, Volume higher, Closing range: 48%, Body: 4%
Good: Higher high, higher low
Bad: Very low A/D ratio, couldn't hold intraday high
Highs/Lows: Higher high, higher low
Candle: Indecisive doji star candle with thin red body
Advanced/Decline: 0.36, almost three declining stocks for every advancing stock
Indexes: SPX (+0.16%), DJI (+0.04%), RUT (-0.93%), VIX (-0.77%)
Sectors: Consumer Staples (XLP +0.83%) at Utilities (XLU +0.70%) at the top. Financials (XLF -0.75%) and Energy (XLE -1.18%) at the bottom.
Expectation: Sideways
Consumer Sentiment data released this morning was lower than during the height of the pandemic, signaling the public is exhausted from wave after wave of COVID cases. The market didn't overreact to the surprisingly low data, but caution was present with yields dropping and sectors used as defensive investments soaring.
The Nasdaq closed with a slight +0.04% gain. Volume was a bit higher than the previous day. The doji star candle has a small thin body sitting in the middle of two equal-length wicks. The candle shows indecision and is often a bearish reversal in an uptrend. There were almost three declining stocks for every advancing stock.
-=x=-=x=-=x=-=x=-=x=-=x=-=x=-
View on the Week
The S&P 500 and Dow Jones set new records this week while the Nasdaq struggled with a rotation and indecision from investors. Small caps took a step back while value stocks marched forward.
The week opened with caution triggered by rising cases of the Delta variant and more reports of full hospital beds around the United States. The result wasn't terrible for the indexes, possibly propped up by a positive jobs report. However, investors focused on defensive sectors for the day.
The Infrastructure Bill passing the Senate on Tuesday was the pivotal moment for the week. That set off a two-day rotation back into value and recovery stocks and sent the cyclical sectors to the top of the sector list. It also kicked off four consecutive days of record closes for the S&P 500 and Dow Jones.
Throughout the week, investors balanced worries about the pandemic with positive economic news. Employment data continues to be strong. Inflation is still high but not out of control. The Fed could start tapering earlier than expected. However, that didn't seem a concern during Wednesday's 10-year Treasury Note auction, which showed strong demand.
The earnings season continued with primarily positive reports. Just as last week, the reactions to positive and negative earnings news were oversized. Upstart (UPST) soared 45% in three days after earnings. Unity Software (U) rose 20% in three days. Opendoor (OPEN) rose 20% after earnings. On the other hand, Digital Turbine (APPS) lost 6% the day after earnings. Cannabis supply company GrowGeneration (GRWG) sank 30% over the two days after earnings.
The rotation snapped back toward big tech on Thursday, but the rally for the Nasdaq dampened on Friday after surprisingly low consumer sentiment data. The data was lower than last summer and at its lowest point in the past ten years. That pushed investors back into Treasuries and defensive sectors heading into the weekend.
The Nasdaq declined -0.09% for the week. Volume was lower than the previous week. The closing range of 65% is good as the index successfully tested support at the 21d exponential moving average line twice during the week. On the daily chart, I adjusted a rising wedge that is heading toward 15,000 resistance. As volatility gets tighter approaching the tip of the wedge, the index may break out of the pattern higher, or it may break to the downside.
The S&P 500 (SPX) and Dow Jones Industrial Average (DJI) closed the week at new records with +0.71% and +0.87% gains.
The Russell 2000 (RUT) declined -1.10% for the week.
The VIX volatility declined -4.33% for the week.
Materials ( XLB ) led the sector list for the week, getting a massive boost on Tuesday and Wednesday after the Infrastructure bill passed the Senate. Industrials ( XLI ) also got a boost from the bill.
Financials ( XLF ) contented for the top spot, gaining from rising Treasury yields that positively impact performance for the sector. However, yields dropped on Friday, and the sector dropped back to third place.
The defensive sectors of Consumer Staples ( XLP ) and Utilities ( XLU ) also ended the week near the top of the list, signaling caution throughout the week as investors worry about rising cases of COVID in the US and around the world.
Energy ( XLE ) had a few good days but ended the week in the last place.
Yields for the US 30y, 10y, and 2y Treasuries all declined for the week. The gap tightened a bit after last week's rise in long-term yields.
Both High Yield Corporate Bond (HYG) and Investment Grade Bond (LQD) prices rose.
The US Dollar (DXY) declined -0.28% for the week. The dollar gained throughout the week but fell sharply on Friday after the terrible consumer sentiment data.
Silver (SILVER) declined -2.46%, while Gold (GOLD) advanced +0.94%.
Crude Oil (CRUDEOIL1!) declined -0.29%.
Timber (WOOD) advanced +2.42%.
Copper (COPPER1!) advanced +0.12%.
Aluminum (ALI1!) advanced +0.64%.
-=x=-=x=-=x=-=x=-=x=-=x=-=x=-
Big Four Mega-caps
Apple (AAPL), Alphabet (GOOGL), and Microsoft (MSFT) all had record weekly closes. Apple rose +2.03% for the week. Alphabet (GOOGL) advanced +1.47%. Microsoft gained +1.17%. Amazon (AMZN) was the only of the largest four mega-caps to lose for the week, declining -1.52% and still testing support at its 40-week moving average line.
-=x=-=x=-=x=-=x=-=x=-=x=-=x=-
The Four Recovery Stocks
I picked four recovery stocks to track against the indexes and other indicators in this weekly report. All four declined for the week as concerns over the Delta variant continue to rise. Marriott (MAR) had the most significant loss, moving down -5.09% and closing below the 10-week and 40-week moving average lines. Carnival Cruise Lines (CCL) and Delta Airlines (DAL) declined -0.95% and -1.04% for the week. Exxon Mobil (XOM) lost -1.88%.
-=x=-=x=-=x=-=x=-=x=-=x=-=x=-
Cryptocurrency
I started tracking four major cryptocurrencies on the week in review. The four are Bitcoin, Ethereum, Litecoin, and Bitcoin Cash. The latter two are not the largest by market cap but seem to be well-known and are part of the CIX capital.com index, tracking five cryptocurrencies, including these four (Ripple is the fifth).
It was another good week for the cryptocurrencies, especially Litecoin (LTCUSD) and Bitcoin Cash (BTHUSD), attempting to catch up with the other two. Litecoin advanced +23.27%, while Bitcoin Cash rose +26.48%. Ethereum (ETHUSD) gained +9.85%. Bitcoin (BTCUSD) grew +7.27%. Looking at cryptocurrencies, it's still difficult to read the signals on sentiment. The market is either favoring risk now or looking for stores of value ahead of volatility in equities.
-=x=-=x=-=x=-=x=-=x=-=x=-=x=-
Investor Sentiment
The put/call ratio (PCCE) ended the week at 0.643.
The CNN Fear & Greed Index moved toward neutral throughout the week but was still in the Fear range at the end of the week.
The NAAIM money manager exposure index remained about the same at 97.55.
-=x=-=x=-=x=-=x=-=x=-=x=-=x=-
The Week Ahead
There are a lot of earnings reports, and I won't try to list them all here. Check your portfolio for earnings events to prevent surprises.
Monday
Manufacturing data from New York will be available before the market open on Monday.
Roblox (RBLX), Paysafe (PSFE), Niu Tech (NIU), and Porch Group (PRCH) are a few of the interesting earnings reports for Monday.
Tuesday
Tuesday brings several bits of economic data. Retail Sales data and Industrial Production data are available before the market opens. Business Inventories and Retail Inventories become available after the market opens. The Fed's Jerome Powell is scheduled to speak in the early afternoon.
Adding to the Retail economic data, Walmart (WMT), Home Depot (HD), and Sea Limited (SE) have earnings reports in the morning.
Wednesday
Wednesday's economic data include Building Permits and Housing Starts before the market opens. After the market opens, we'll get an update on Crude Oil Inventories. The Fed will release last month's meeting minutes in the afternoon.
Tencent (TCEHY), Nvidia (NVDA), Cisco (CSCO), Lowe's (LOW), Target (TGT), TJX (TJX), Synopsys (SNPS), and Bath Body Works (BBWI) are some of the earnings reports for Wednesday.
Thursday
Initial Jobless Claims data will be available on Thursday morning. We'll also get the Philadelphia Manufacturing Index on Thursday. Last month, the New York and Philadelphia indexes showed different readings on manufacturing activity.
Applied Materials (AMAT), Estee Lauder (EL), Ross Stores (ROST), Farfetch (FTCH), Kohls (KSS), and Macy's (M) are some of the earnings reports for Thursday.
Friday
There is not much economic news scheduled for Friday.
Deere & Company (DE), Foot Locker (FL), and Buckle (BKE) are a few earnings reports to watch on a light day for earnings.
-=x=-=x=-=x=-=x=-=x=-=x=-=x=-
The Bullish Side
It's not hard to find bullish signals across the market. The S&P 500 and Dow Jones are sitting at record highs with no sign of weakness in the charts. Commodity prices show high demand for resources key to economic growth. The US Treasuries market and Corporate bond markets are both signaling confidence in US companies.
For the Nasdaq, it's a bit harder to spot the bullishness since there is such a divide between companies that show strong guidance for the second half of the year and companies showing caution. Looking at the market leaders, we have bullish growth in Apple, Microsoft, Alphabet, and Facebook. And there is plenty of support for companies that continue to deliver despite the changing economic environment.
Employment data shows companies continue to get back to business and are hiring workers despite the recent growth in the Delta variant of COVID. And while inflation continues to be high, it's beginning to show signs of slowing, if not pulling back a bit.
-=x=-=x=-=x=-=x=-=x=-=x=-=x=-
The Bearish Side
The consumer sentiment data released on Friday is the most prominent bearish signal moving into the middle of August. The numbers were lower than last summer at the height of the pandemic. And the numbers are at their lowest in ten years. The sentiment is a reflection of how exhausted the public is with the pandemic. With cases rising again and reports of full hospitals, consumers fear the worst.
Could a resurgence in the pandemic shutter the economy again? If so, does the government still have resources to support after spending so much the past year? All eyes and ears will be on the Fed's Jerome Powell as he comments on Tuesday afternoon.
-=x=-=x=-=x=-=x=-=x=-=x=-=x=-
Key Nasdaq Levels to Watch
The Nasdaq moved sideways this week and continues to form a wedge within an uptrend as it heads toward a psychological resistance point at 15,000.
On the positive side, the levels are:
On the downside, there are a few key levels:
-=x=-=x=-=x=-=x=-=x=-=x=-=x=-
Wrap-up
Last week we questioned where the market wanted to move next. For the S&P 500 and Dow Jones, the answer was higher. For the Nasdaq, the answer was not sure. That uncertainty showed at the end of the week as well. Friday's daily candle is a bearish doji style candle that marks indecision and a possible reversal from an uptrend.
There are both bulls and bears presenting a solid case right now. Keep an eye on your portfolio and make sure stops are up to day just in case things turn bearish. Also, watch out for any earnings events as the reactions have been severe to any bad news.
Good luck, stay healthy, and trade safe!
Notes
- The Market Week in Review is my weekend homework where I look over what happened in the previous week and what might come in the next week.
- I occasionally have some errors or typos and will correct them in my blog or the comments on TradingView. I do not have an editor and do this in my free time.
- If you find this helpful, please let me know in the comments. I am also more than happy to add new perspectives and data points if you have ideas.
The structure is the following:
- A recap of the daily updates that I do here on TradingView.
- View on the past week
- What's coming in the next week
- The Bullish View, The Bearish View
- Key index levels to watch out for
- Wrap-up
If you have been following my daily updates, you can skip down to "View on the Week." If not, then this first part is a great play-by-play recap for the week. Click the daily charts for more detail on sectors, indexes, and market leaders each day.
-=x=-=x=-=x=-=x=-=x=-=x=-=x=-
Monday, August 9, 2021
Facts: +0.16%, Volume lower, Closing range: 71%, Body: 5%
Good: Higher low, small gain on otherwise cautious day
Bad: Lower high, indecisive day
Highs/Lows: Lower high, higher low
Candle: Another inside day, indecisive candle with thin body in the upper half
Advanced/Decline: 0.67, three declining stocks for every advancing stock
Indexes: SPX (-0.09%), DJI (-0.30%), RUT (-0.58%), VIX (+3.53%)
Sectors: Health (XLV +0.38%) and Consumer Staples (XLP +0.37%) at the top. Real Estate (XLRE -0.45%) and Energy (XLY -1.41%) at the bottom.
Expectation: Sideways
It was another inside day for the Nasdaq as the market entered the week with caution. The Delta variant of the virus continues to rise while strong employment data is turning the Fed toward more tapering discussion. The combination drove the dollar higher and Treasury prices lower.
The Nasdaq ended the day with a small advance, gaining +0.16%. The thin 5% body is in the upper half of the candle which has a lower high and higher high than the previous day. That's the second inside day in a row as the market consolidates before choosing a direction. The closing range of 71% is a positive but there were three declining stocks for every two advancing stocks.
-=x=-=x=-=x=-=x=-=x=-=x=-=x=-
Tuesday, August 10, 2021
Facts: -0.49%, Volume lower, Closing range: 24%, Body: 71%
Good: Higher high, lower volume on decline
Bad: Lower low, low closing range
Highs/Lows: Higher high, lower low
Candle: Outside day made of mostly selling after the morning high.
Advanced/Decline: 0.66, three declining stocks for every advancing stock
Indexes: SPX (+0.10%), DJI (+0.46%), RUT (+0.20%), VIX (+0.42%)
Sectors: Energy (XLE +1.76%) and Materials (XLB +1.51%) at the top. Technology (XLK -0.72%) and Real Estate (XLRE -1.07%) at the bottom.
Expectation: Sideways or Lower
Value stocks were in the spotlight today after the passing of the infrastructure bill in the Senate initiated a rotation into cyclical sectors. The result was new record closes for the Dow Jones and S&P 500.
The Nasdaq closed with a -0.49% loss for the day. Volume was lower than the previous day. Three stocks declined for every two advancing stocks. The index attempted a rally in the morning but sold off quickly, resulting in a 71% red body and 24% closing range. The lower wick is longer than the upper wick. The higher high and lower low create an outside day following two inside days.
-=x=-=x=-=x=-=x=-=x=-=x=-=x=-
Wednesday, August 11, 2021

Facts: -0.16%, Volume higher, Closing range: 48%, Body: 46%
Good: Support at 21d EMA, rally after support creates longer lower wick
Bad: Lower high, morning selling after hitting intraday high
Highs/Lows: Lower high, lower low
Candle: Red body covers upper half of candle, long lower wick covers lower half.
Advanced/Decline: 0.83, more declining stocks than advancing stocks
Indexes: SPX (+0.25%), DJI (+0.62%), RUT (+0.49%), VIX (-4.35%)
Sectors: Materials (XLB +1.41%) and Industrials (XLI +1.30%) at the top. Technology (XLK +0.01%) and Health (XLV -0.99%) at the bottom.
Expectation: Sideways or Lower
Recovery and value stocks helped send the S&P 500 and Dow Jones to yet another record close on the day after the Infrastructure bill made it through the Senate.
The Nasdaq closed with a loss of -0.16%. Volume was slightly higher than the previous day. The index opened up with a short rally to the intraday high and then sold off through the morning until getting support at the 21d exponential moving average before moving higher. The action created a long lower wick underneath a 46% red body and resulted in a 48% closing range. There were more declining stocks than advancing stocks on the growth-heavy Nasdaq. Beyond the Nasdaq, there were far more advancing stocks than declining stocks in the US markets.
-=x=-=x=-=x=-=x=-=x=-=x=-=x=-
Thursday, August 12, 2021

Facts: +0.35%, Volume higher, Closing range: 94%, Body: 52%
Good: Another test with support at 21d EMA, green body over long lower wick
Bad: Low A/D ratio, lower high
Highs/Lows: Lower high, higher low
Candle: Inside day, green body covers upper half of the candle.
Advanced/Decline: 0.49, two declining stocks for every advancing stock
Indexes: SPX (+0.30%), DJI (+0.04%), RUT (-0.28%), VIX (-3.05%)
Sectors: Health (XLV +0.79%) and Technology (XLK +0.57%) at the top. Materials (XLB -0.16%) and Industrials (XLI -0.10%) at the bottom.
Expectation: Sideways
Jobs data helped boost the markets to more records today with big tech helping lead the way higher. The S&P 500 and Dow Jones Industrial Average both closed at record highs for the third day in a row.
The Nasdaq finished the day with a +0.35% gain on slightly higher volume than the previous day. The index declined after open but found support at the 21d exponential moving average line and moved higher the rest of the day. The 52% green body covers the upper half of the candle. The rally in the afternoon resulted in a 94% closing range. A lower high and higher low, marks another inside day for the Nasdaq. There were two declining stocks for every advancing stock.
-=x=-=x=-=x=-=x=-=x=-=x=-=x=-
Friday, August 13, 2021

Facts: +0.04%, Volume higher, Closing range: 48%, Body: 4%
Good: Higher high, higher low
Bad: Very low A/D ratio, couldn't hold intraday high
Highs/Lows: Higher high, higher low
Candle: Indecisive doji star candle with thin red body
Advanced/Decline: 0.36, almost three declining stocks for every advancing stock
Indexes: SPX (+0.16%), DJI (+0.04%), RUT (-0.93%), VIX (-0.77%)
Sectors: Consumer Staples (XLP +0.83%) at Utilities (XLU +0.70%) at the top. Financials (XLF -0.75%) and Energy (XLE -1.18%) at the bottom.
Expectation: Sideways
Consumer Sentiment data released this morning was lower than during the height of the pandemic, signaling the public is exhausted from wave after wave of COVID cases. The market didn't overreact to the surprisingly low data, but caution was present with yields dropping and sectors used as defensive investments soaring.
The Nasdaq closed with a slight +0.04% gain. Volume was a bit higher than the previous day. The doji star candle has a small thin body sitting in the middle of two equal-length wicks. The candle shows indecision and is often a bearish reversal in an uptrend. There were almost three declining stocks for every advancing stock.
-=x=-=x=-=x=-=x=-=x=-=x=-=x=-
View on the Week
The S&P 500 and Dow Jones set new records this week while the Nasdaq struggled with a rotation and indecision from investors. Small caps took a step back while value stocks marched forward.
The week opened with caution triggered by rising cases of the Delta variant and more reports of full hospital beds around the United States. The result wasn't terrible for the indexes, possibly propped up by a positive jobs report. However, investors focused on defensive sectors for the day.
The Infrastructure Bill passing the Senate on Tuesday was the pivotal moment for the week. That set off a two-day rotation back into value and recovery stocks and sent the cyclical sectors to the top of the sector list. It also kicked off four consecutive days of record closes for the S&P 500 and Dow Jones.
Throughout the week, investors balanced worries about the pandemic with positive economic news. Employment data continues to be strong. Inflation is still high but not out of control. The Fed could start tapering earlier than expected. However, that didn't seem a concern during Wednesday's 10-year Treasury Note auction, which showed strong demand.
The earnings season continued with primarily positive reports. Just as last week, the reactions to positive and negative earnings news were oversized. Upstart (UPST) soared 45% in three days after earnings. Unity Software (U) rose 20% in three days. Opendoor (OPEN) rose 20% after earnings. On the other hand, Digital Turbine (APPS) lost 6% the day after earnings. Cannabis supply company GrowGeneration (GRWG) sank 30% over the two days after earnings.
The rotation snapped back toward big tech on Thursday, but the rally for the Nasdaq dampened on Friday after surprisingly low consumer sentiment data. The data was lower than last summer and at its lowest point in the past ten years. That pushed investors back into Treasuries and defensive sectors heading into the weekend.
The Nasdaq declined -0.09% for the week. Volume was lower than the previous week. The closing range of 65% is good as the index successfully tested support at the 21d exponential moving average line twice during the week. On the daily chart, I adjusted a rising wedge that is heading toward 15,000 resistance. As volatility gets tighter approaching the tip of the wedge, the index may break out of the pattern higher, or it may break to the downside.
The S&P 500 (SPX) and Dow Jones Industrial Average (DJI) closed the week at new records with +0.71% and +0.87% gains.
The Russell 2000 (RUT) declined -1.10% for the week.
The VIX volatility declined -4.33% for the week.

Materials ( XLB ) led the sector list for the week, getting a massive boost on Tuesday and Wednesday after the Infrastructure bill passed the Senate. Industrials ( XLI ) also got a boost from the bill.
Financials ( XLF ) contented for the top spot, gaining from rising Treasury yields that positively impact performance for the sector. However, yields dropped on Friday, and the sector dropped back to third place.
The defensive sectors of Consumer Staples ( XLP ) and Utilities ( XLU ) also ended the week near the top of the list, signaling caution throughout the week as investors worry about rising cases of COVID in the US and around the world.
Energy ( XLE ) had a few good days but ended the week in the last place.
Yields for the US 30y, 10y, and 2y Treasuries all declined for the week. The gap tightened a bit after last week's rise in long-term yields.
Both High Yield Corporate Bond (HYG) and Investment Grade Bond (LQD) prices rose.
The US Dollar (DXY) declined -0.28% for the week. The dollar gained throughout the week but fell sharply on Friday after the terrible consumer sentiment data.
Silver (SILVER) declined -2.46%, while Gold (GOLD) advanced +0.94%.
Crude Oil (CRUDEOIL1!) declined -0.29%.
Timber (WOOD) advanced +2.42%.
Copper (COPPER1!) advanced +0.12%.
Aluminum (ALI1!) advanced +0.64%.
-=x=-=x=-=x=-=x=-=x=-=x=-=x=-
Big Four Mega-caps
Apple (AAPL), Alphabet (GOOGL), and Microsoft (MSFT) all had record weekly closes. Apple rose +2.03% for the week. Alphabet (GOOGL) advanced +1.47%. Microsoft gained +1.17%. Amazon (AMZN) was the only of the largest four mega-caps to lose for the week, declining -1.52% and still testing support at its 40-week moving average line.
-=x=-=x=-=x=-=x=-=x=-=x=-=x=-
The Four Recovery Stocks
I picked four recovery stocks to track against the indexes and other indicators in this weekly report. All four declined for the week as concerns over the Delta variant continue to rise. Marriott (MAR) had the most significant loss, moving down -5.09% and closing below the 10-week and 40-week moving average lines. Carnival Cruise Lines (CCL) and Delta Airlines (DAL) declined -0.95% and -1.04% for the week. Exxon Mobil (XOM) lost -1.88%.
-=x=-=x=-=x=-=x=-=x=-=x=-=x=-
Cryptocurrency
I started tracking four major cryptocurrencies on the week in review. The four are Bitcoin, Ethereum, Litecoin, and Bitcoin Cash. The latter two are not the largest by market cap but seem to be well-known and are part of the CIX capital.com index, tracking five cryptocurrencies, including these four (Ripple is the fifth).
It was another good week for the cryptocurrencies, especially Litecoin (LTCUSD) and Bitcoin Cash (BTHUSD), attempting to catch up with the other two. Litecoin advanced +23.27%, while Bitcoin Cash rose +26.48%. Ethereum (ETHUSD) gained +9.85%. Bitcoin (BTCUSD) grew +7.27%. Looking at cryptocurrencies, it's still difficult to read the signals on sentiment. The market is either favoring risk now or looking for stores of value ahead of volatility in equities.
-=x=-=x=-=x=-=x=-=x=-=x=-=x=-
Investor Sentiment
The put/call ratio (PCCE) ended the week at 0.643.
The CNN Fear & Greed Index moved toward neutral throughout the week but was still in the Fear range at the end of the week.
The NAAIM money manager exposure index remained about the same at 97.55.
-=x=-=x=-=x=-=x=-=x=-=x=-=x=-
The Week Ahead
There are a lot of earnings reports, and I won't try to list them all here. Check your portfolio for earnings events to prevent surprises.
Monday
Manufacturing data from New York will be available before the market open on Monday.
Roblox (RBLX), Paysafe (PSFE), Niu Tech (NIU), and Porch Group (PRCH) are a few of the interesting earnings reports for Monday.
Tuesday
Tuesday brings several bits of economic data. Retail Sales data and Industrial Production data are available before the market opens. Business Inventories and Retail Inventories become available after the market opens. The Fed's Jerome Powell is scheduled to speak in the early afternoon.
Adding to the Retail economic data, Walmart (WMT), Home Depot (HD), and Sea Limited (SE) have earnings reports in the morning.
Wednesday
Wednesday's economic data include Building Permits and Housing Starts before the market opens. After the market opens, we'll get an update on Crude Oil Inventories. The Fed will release last month's meeting minutes in the afternoon.
Tencent (TCEHY), Nvidia (NVDA), Cisco (CSCO), Lowe's (LOW), Target (TGT), TJX (TJX), Synopsys (SNPS), and Bath Body Works (BBWI) are some of the earnings reports for Wednesday.
Thursday
Initial Jobless Claims data will be available on Thursday morning. We'll also get the Philadelphia Manufacturing Index on Thursday. Last month, the New York and Philadelphia indexes showed different readings on manufacturing activity.
Applied Materials (AMAT), Estee Lauder (EL), Ross Stores (ROST), Farfetch (FTCH), Kohls (KSS), and Macy's (M) are some of the earnings reports for Thursday.
Friday
There is not much economic news scheduled for Friday.
Deere & Company (DE), Foot Locker (FL), and Buckle (BKE) are a few earnings reports to watch on a light day for earnings.
-=x=-=x=-=x=-=x=-=x=-=x=-=x=-
The Bullish Side
It's not hard to find bullish signals across the market. The S&P 500 and Dow Jones are sitting at record highs with no sign of weakness in the charts. Commodity prices show high demand for resources key to economic growth. The US Treasuries market and Corporate bond markets are both signaling confidence in US companies.
For the Nasdaq, it's a bit harder to spot the bullishness since there is such a divide between companies that show strong guidance for the second half of the year and companies showing caution. Looking at the market leaders, we have bullish growth in Apple, Microsoft, Alphabet, and Facebook. And there is plenty of support for companies that continue to deliver despite the changing economic environment.
Employment data shows companies continue to get back to business and are hiring workers despite the recent growth in the Delta variant of COVID. And while inflation continues to be high, it's beginning to show signs of slowing, if not pulling back a bit.
-=x=-=x=-=x=-=x=-=x=-=x=-=x=-
The Bearish Side
The consumer sentiment data released on Friday is the most prominent bearish signal moving into the middle of August. The numbers were lower than last summer at the height of the pandemic. And the numbers are at their lowest in ten years. The sentiment is a reflection of how exhausted the public is with the pandemic. With cases rising again and reports of full hospitals, consumers fear the worst.
Could a resurgence in the pandemic shutter the economy again? If so, does the government still have resources to support after spending so much the past year? All eyes and ears will be on the Fed's Jerome Powell as he comments on Tuesday afternoon.
-=x=-=x=-=x=-=x=-=x=-=x=-=x=-
Key Nasdaq Levels to Watch
The Nasdaq moved sideways this week and continues to form a wedge within an uptrend as it heads toward a psychological resistance point at 15,000.
On the positive side, the levels are:
- The high of this last week was a new all-time high at 14,896.47. That's more important than this week's high, which is just under the mark.
- The round number 15,000 is likely to be a new area of resistance. It is also the upper resistance line of the rising wedge. Break thru that point for another bullish run.
On the downside, there are a few key levels:
- The 10d MA is at 14,800.63.
- The 21d EMA is at 14,725.27.
- 14,692.41 is the low of the past week. Also, a critical level for a break lower from the rising wedge.
- The 50d MA is at 14,489.15.
- 14,200 remains a critical level if the index moves downward.
- 14,000 has been an area of support/resistance.
- There is a pivot at 13,903.73, which
- A further pullback would likely hit the 200d moving average at 13,447.36. The index hasn't approached this line since rising above it in April 2020.
-=x=-=x=-=x=-=x=-=x=-=x=-=x=-
Wrap-up
Last week we questioned where the market wanted to move next. For the S&P 500 and Dow Jones, the answer was higher. For the Nasdaq, the answer was not sure. That uncertainty showed at the end of the week as well. Friday's daily candle is a bearish doji style candle that marks indecision and a possible reversal from an uptrend.
There are both bulls and bears presenting a solid case right now. Keep an eye on your portfolio and make sure stops are up to day just in case things turn bearish. Also, watch out for any earnings events as the reactions have been severe to any bad news.
Good luck, stay healthy, and trade safe!