Summary: Last week's fears melted away to optimism. The Nasdaq rallied to a new all-time high and record weekly close. The S&P 500 marked yet another record close, which has become a common occurrence this year. Yet, the bigger story was with small-caps and the Russell 2000, leading the market higher and building some structural support in the market to continue the rally in the final quarter of the year.
Notes
The structure is the following:
If you have been following my daily updates, you can skip down to "View on the Week." If not, then this first part is a great play-by-play recap for the week. Click the daily charts for more detail on sectors, indexes, and market leaders each day.
-=x=-=x=-=x=-=x=-=x=-=x=-=x=-
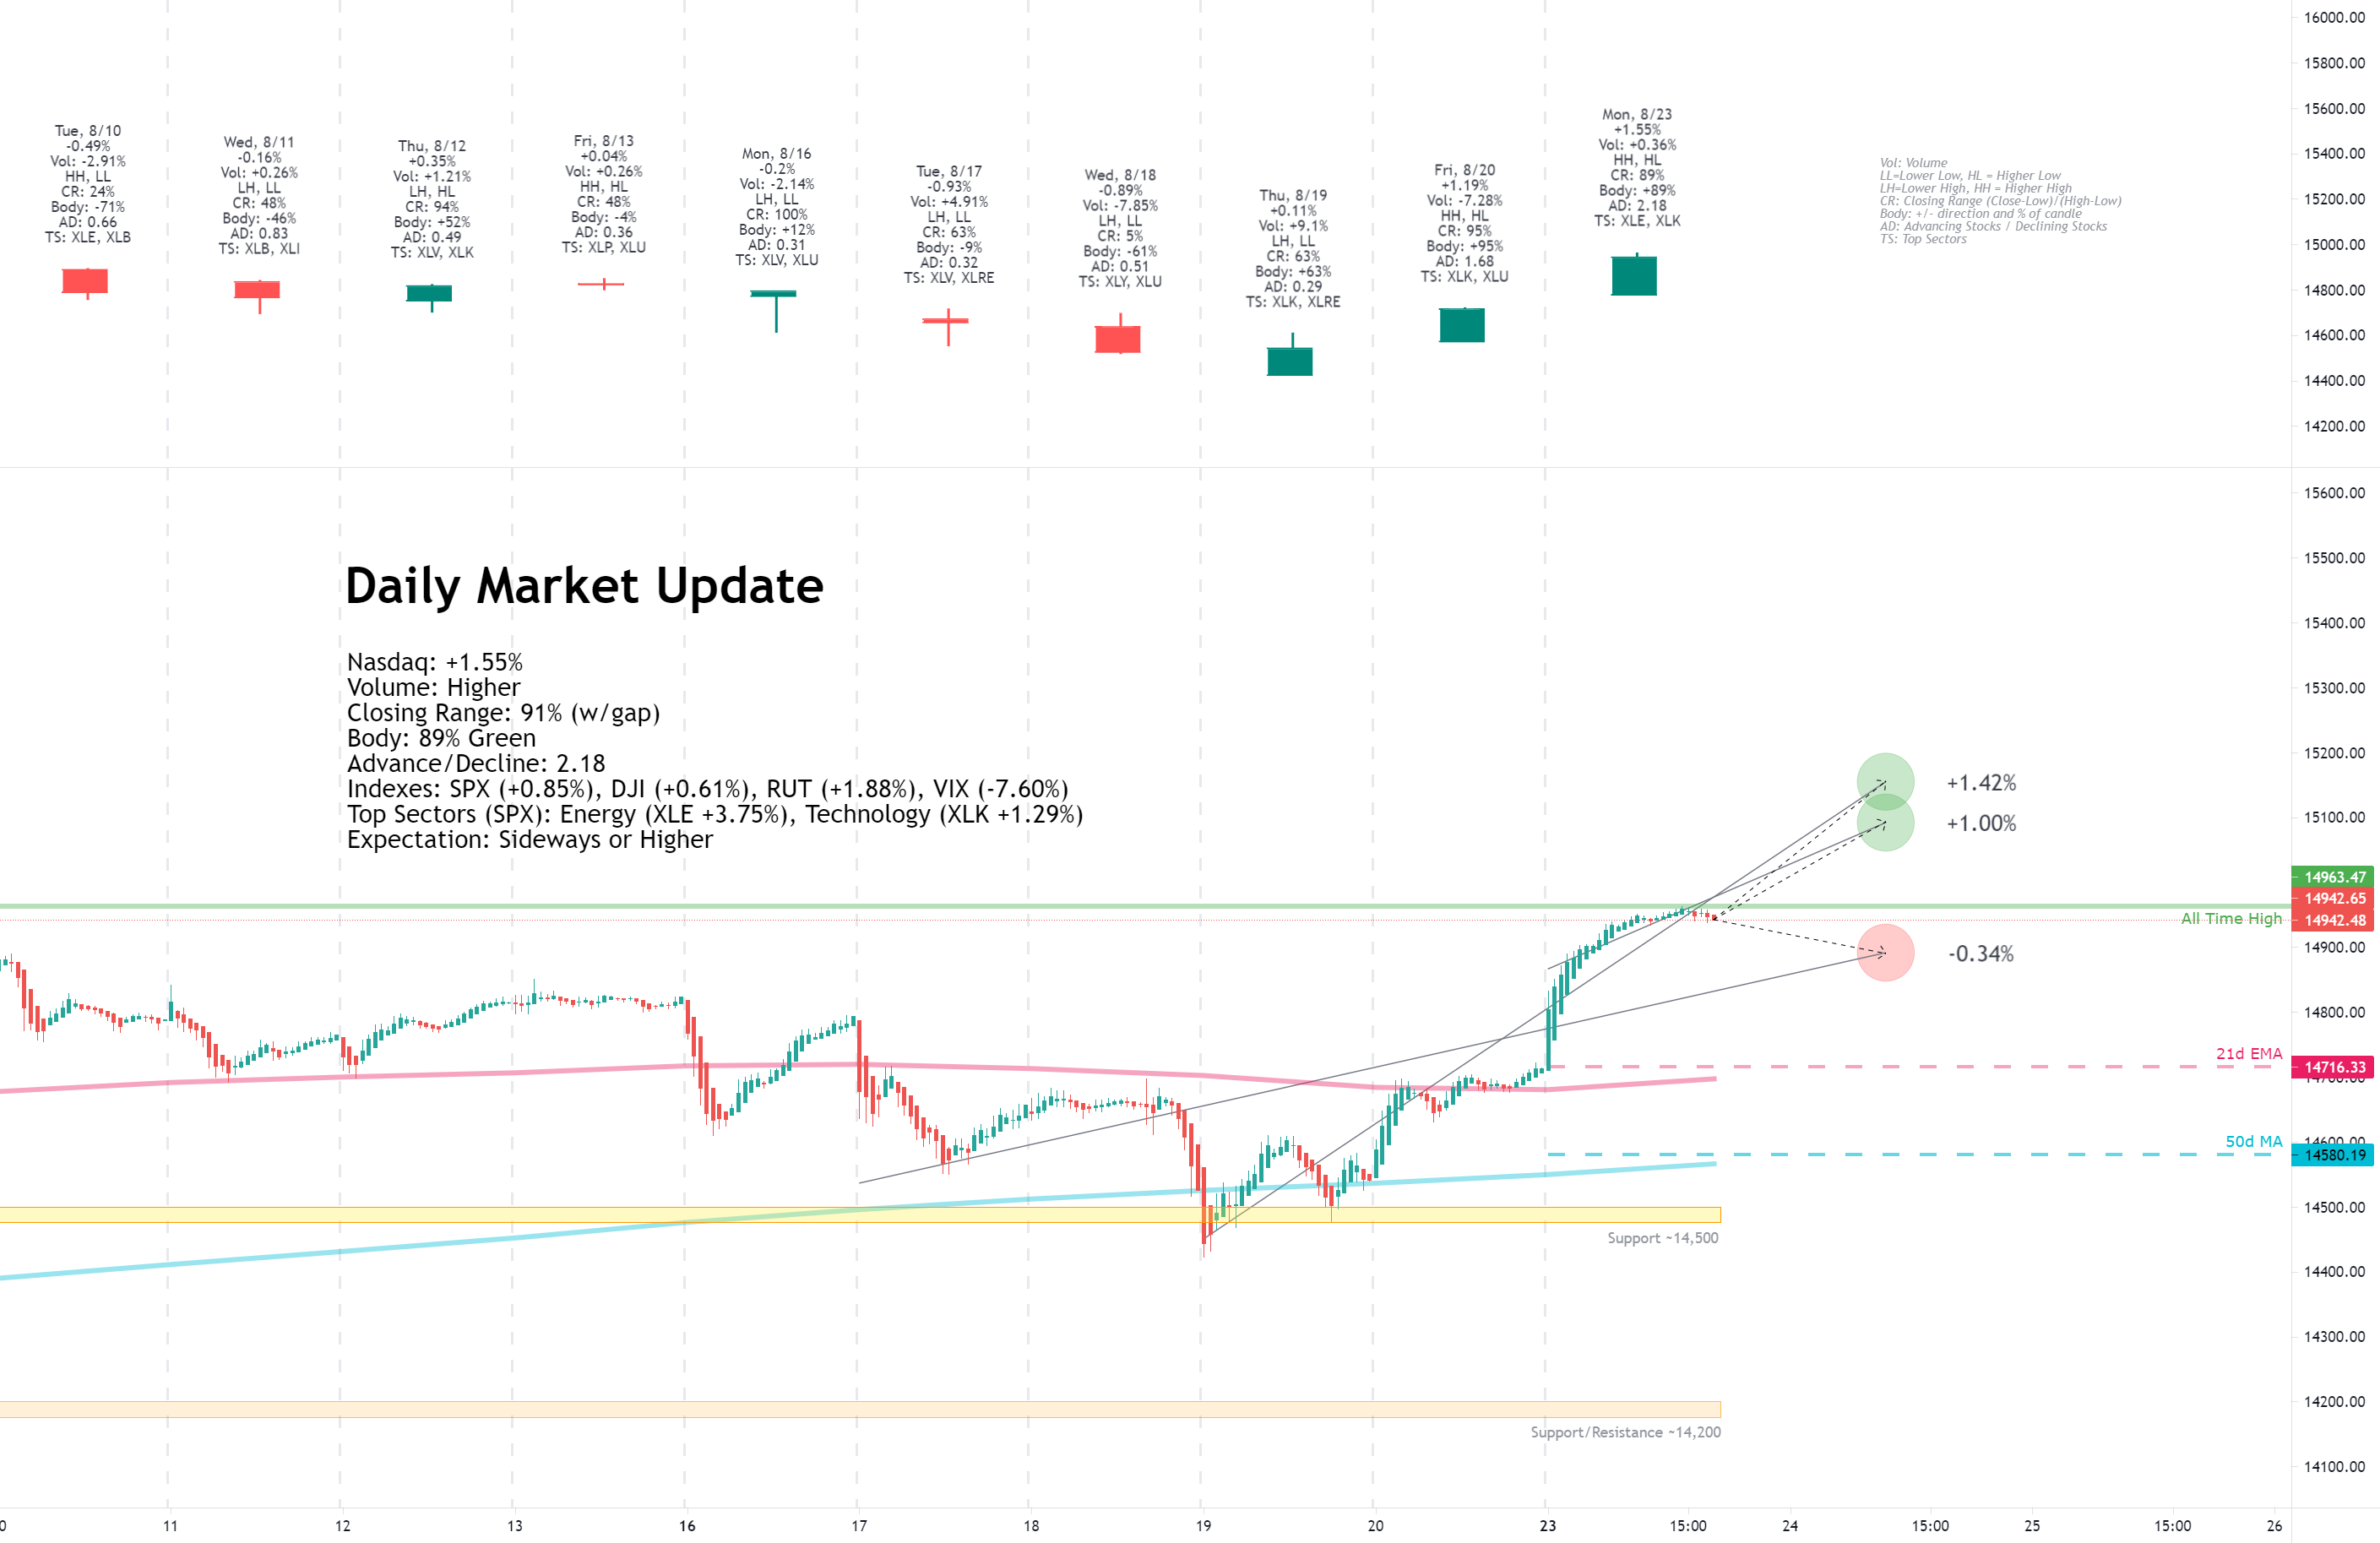
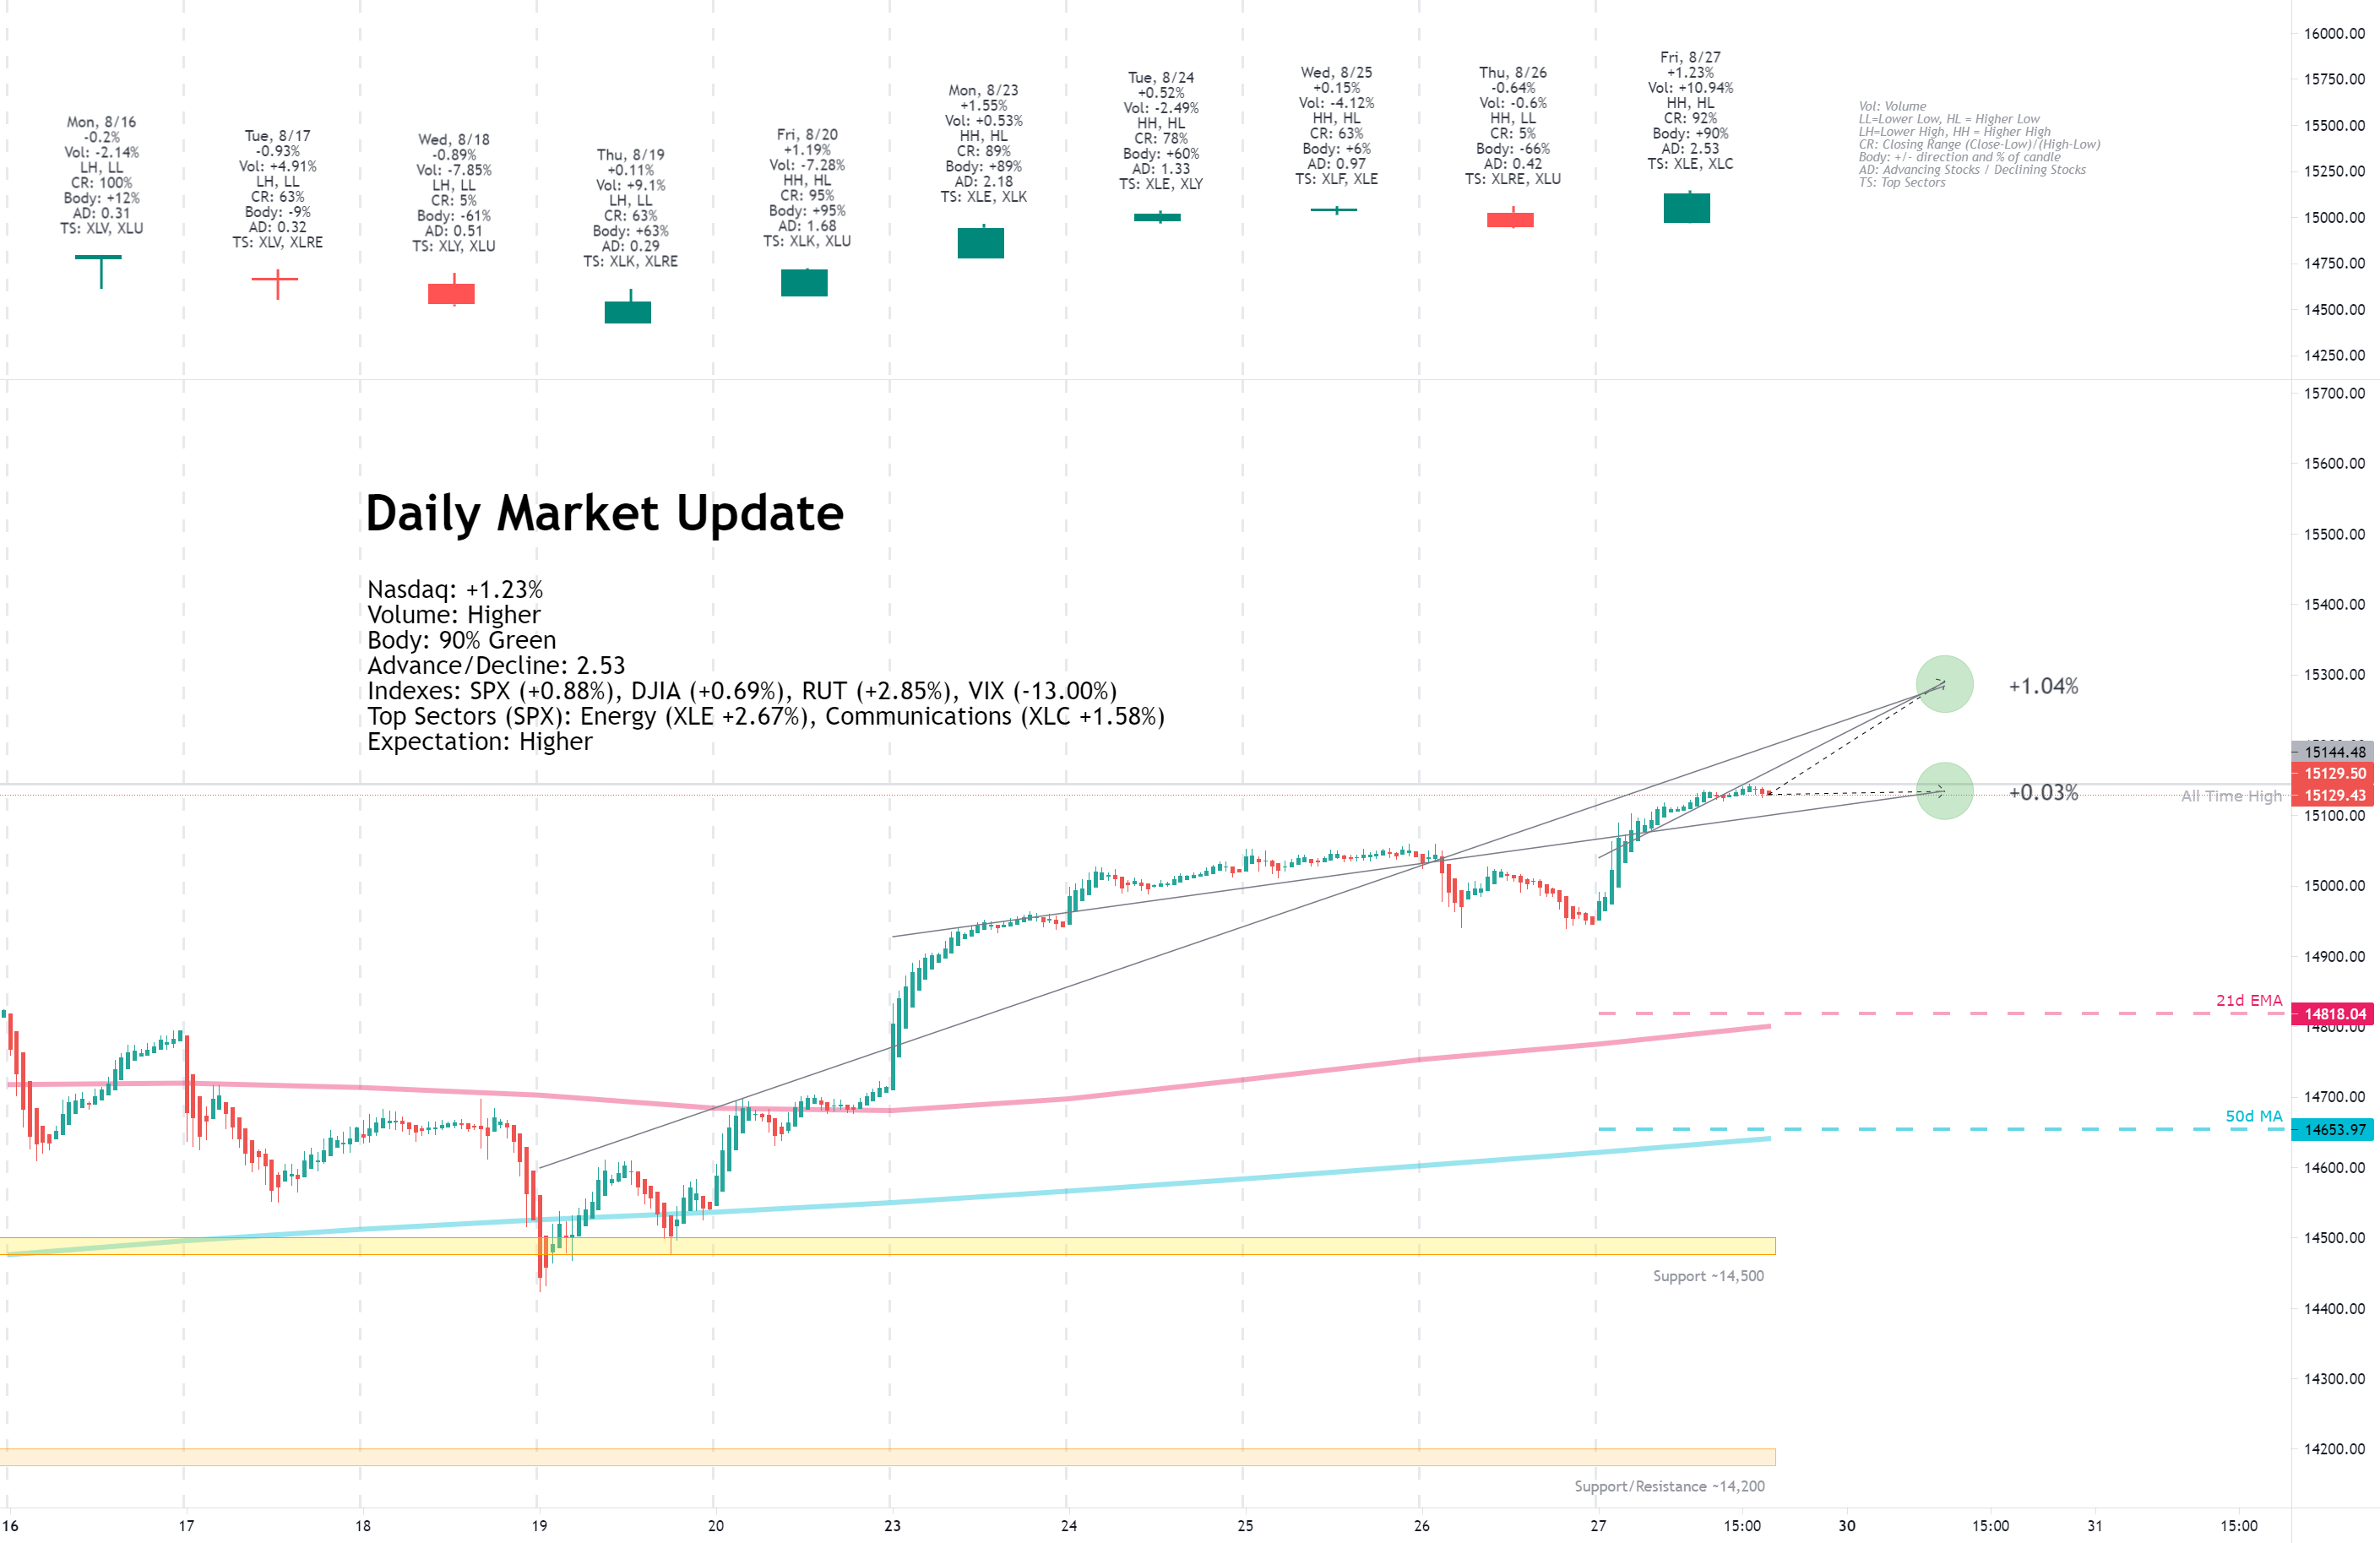
Monday, August 23, 2021

Facts: +1.55%, Volume higher, Closing Range:
91% (w/gap), Body: 89% Green
Good: No lower wick and small upper wick, thick green body with big gain on higher volume
Bad: Nothing
Highs/Lows: Higher high, Higher low
Candle: Gap up at open, thick green body under a small upper wick
Advance/Decline: 2.18, more than two advancing stocks for every declining stock
Indexes: SPX (+0.85%), DJI (+0.61%), RUT (+1.88%), VIX (-7.60%)
Sector List: Energy (XLE +3.75%) and Technology (XLK +1.29%) at the top. Real Estate (XLRE -0.38%) and Utilities (XLU -1.29%) at the bottom.
Expectation: Sideways or Higher
On Monday, the market turned optimistic after the FDA fully approved Pfizer's vaccine, adding a third day of gains off of last week's pivot low and ending with a record for the Nasdaq. Gains were broadly shared across stocks, and the defensive sectors dropped to the bottom of the sector list.
The Nasdaq gained +1.55% for the day and set a new all-time high and record close. Volume was higher than the previous day. The candle has no lower wick for the third straight day. The thick green body covers 89% of the candle and is under a tiny upper wick, resulting in a 91% closing range (including the gap up at open). There were more than two advancing stocks for every declining stock.
-=x=-=x=-=x=-=x=-=x=-=x=-=x=-
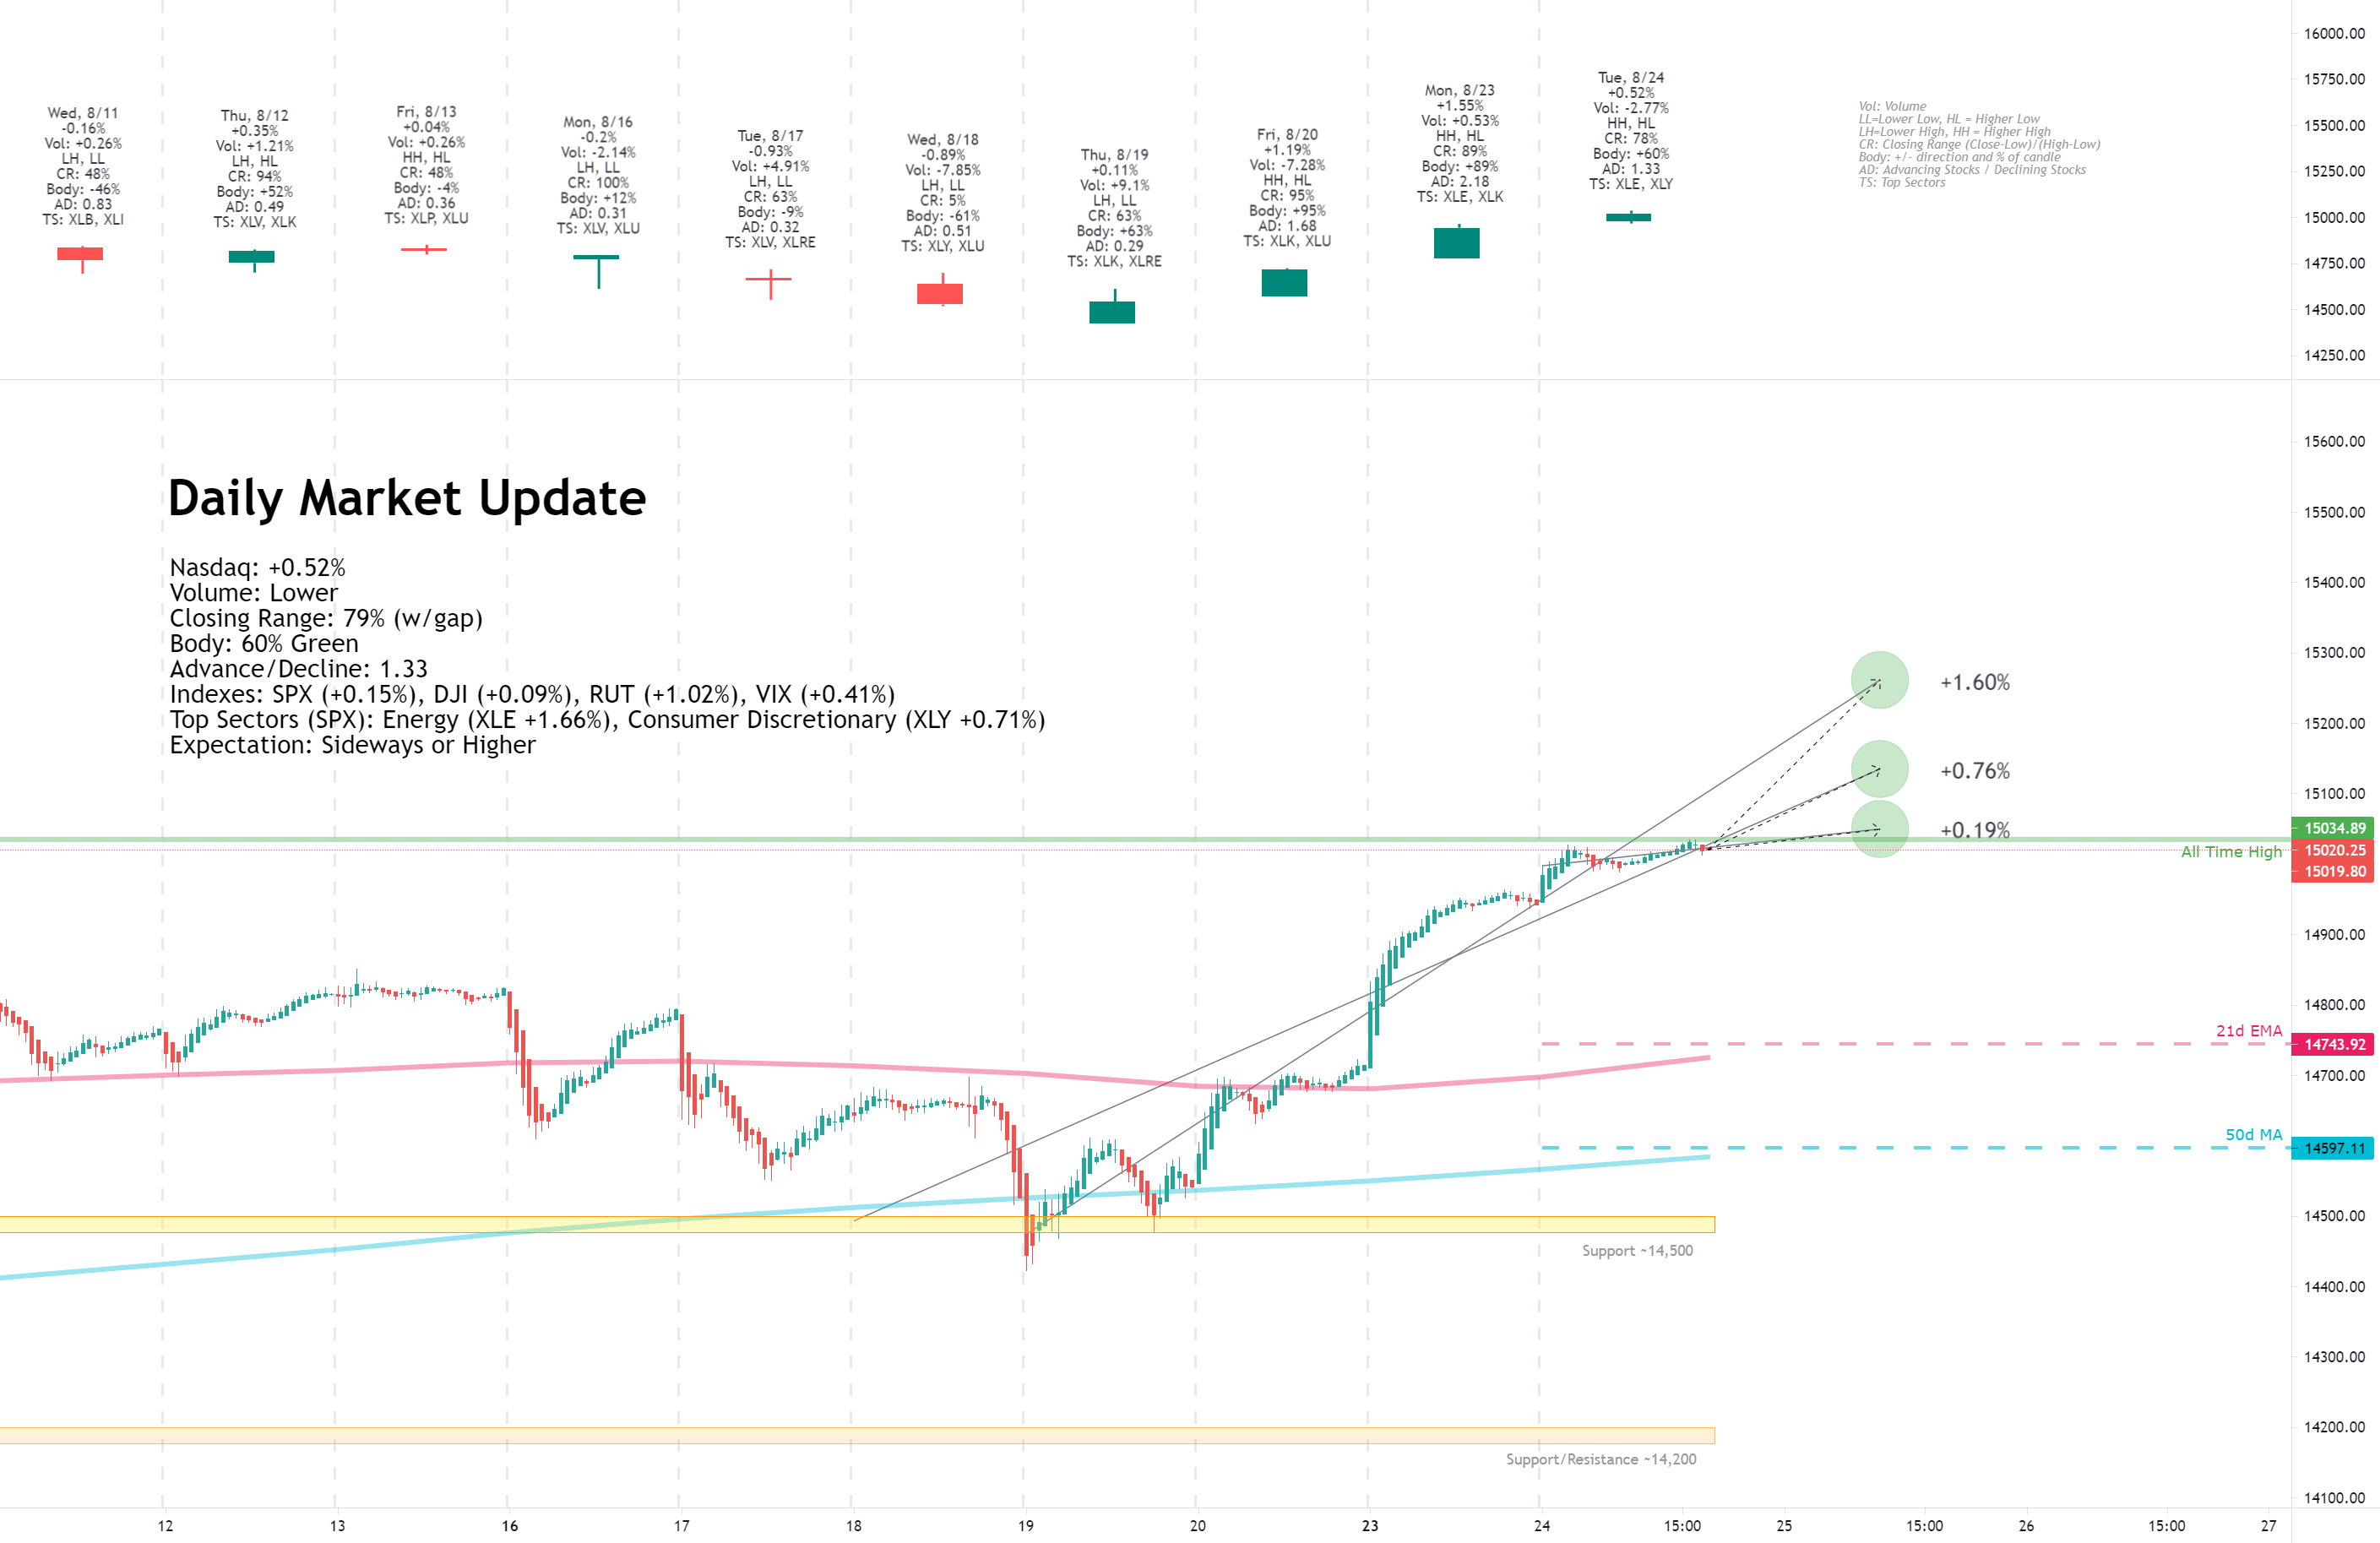
Tuesday, August 24, 2021
Facts: +0.52%, Volume lower, Closing Range: 79% (w/gap), Body: 60% Green
Good: Higher high, higher low, fourth day of green candles
Bad: Lower volume, otherwise nothing
Highs/Lows: Higher high, Higher low
Candle: Thinner candle with small upper and lower wicks, mostly green body
Advance/Decline: 1.33, more advancing than declining stocks
Indexes: SPX (+0.15%), DJI (+0.09%), RUT (+1.02%), VIX (+0.41%)
Sector List: Energy (XLE +1.66%) and Consumer Discretionary (XLY +0.71%) at the top. Real Estate (XLRE -0.75%) and Consumer Staples (XLP -0.76%) at the bottom.
Expectation: Sideways or Higher
Small-caps led the markets higher for a another day, giving indexes their fourth day of gains after last week's dip. Even meme stocks were back in play with huge gains from GME and AMC.
The Nasdaq closed +0.52% higher. Volume was lower than the previous day with a short candle that is still mostly body. The 60% body is in between a small upper and lower wick. The index ended the day with a 79% closing range, including the gap. There were more advancing stocks than declining stocks.
-=x=-=x=-=x=-=x=-=x=-=x=-=x=-
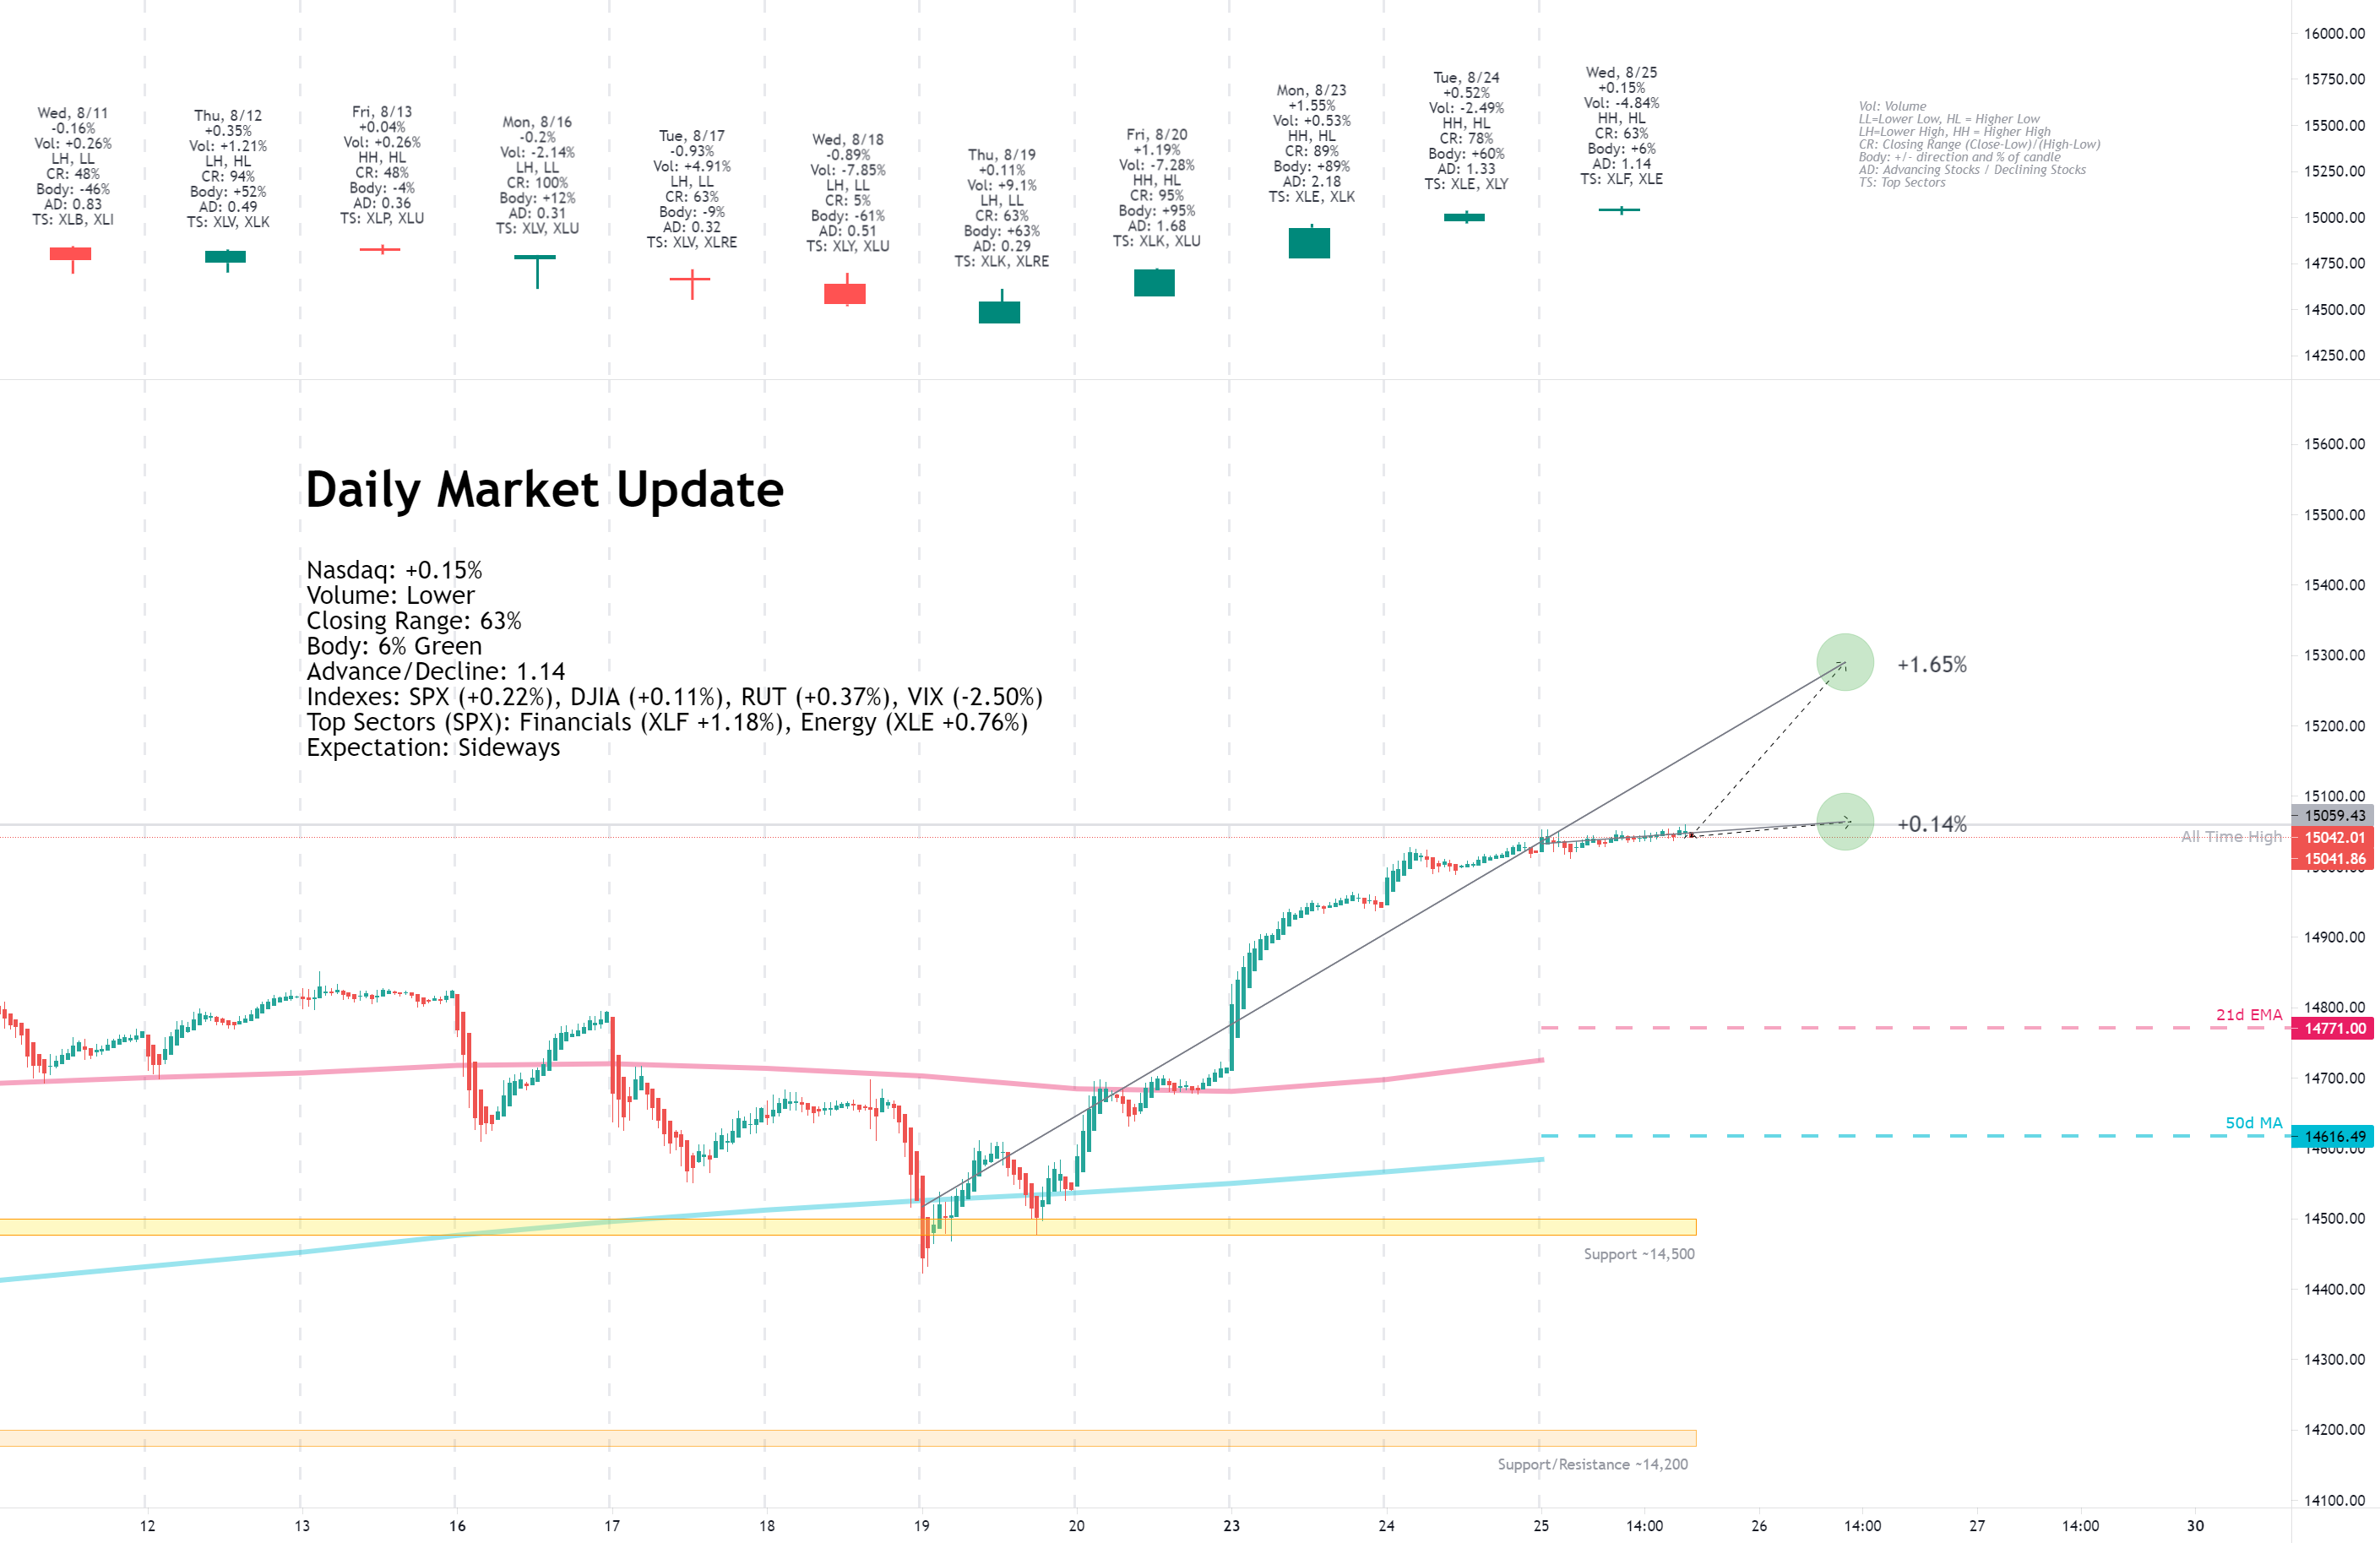
Wednesday, August 25, 2021
Facts: +0.15%, Volume lower, Closing Range: 63%, Body: 6% Green
Good: Low volatility day, high A/D ratio, green candle.
Bad: Indecision marked by thin body
Highs/Lows: Higher high, Higher low
Candle: Spinning top candle with thin body in the middle of similar length wicks.
Advance/Decline: 1.14, more advancing than declining stocks
Indexes: SPX (+0.22%), DJIA (+0.11%), RUT (+0.37%), VIX (-2.50%)
Sector List: Financials (XLF +1.18%) and Energy (XLE +0.76%) at the top. Consumer Staples (XLP -0.17%) and Health (XLV -0.27%) at the bottom.
Expectation: Sideways
The Nasdaq and S&P 500 had another set of record closes while the small-cap Russell 2000 continues to outperform as the market heads higher. Economic news was slightly bullish, with core durable goods and crude oil inventories showing more demand than expected.
The Nasdaq closed with a +0.15% gain, just slightly higher than where it opened. Volume was lower than the previous day and remained lower than the 20-day average. The spinning top candle, marked by a thin body in the middle of short upper and lower wicks, shows indecision in the market as the index hits new all-time highs. There were more advancing than declining stocks.
-=x=-=x=-=x=-=x=-=x=-=x=-=x=-
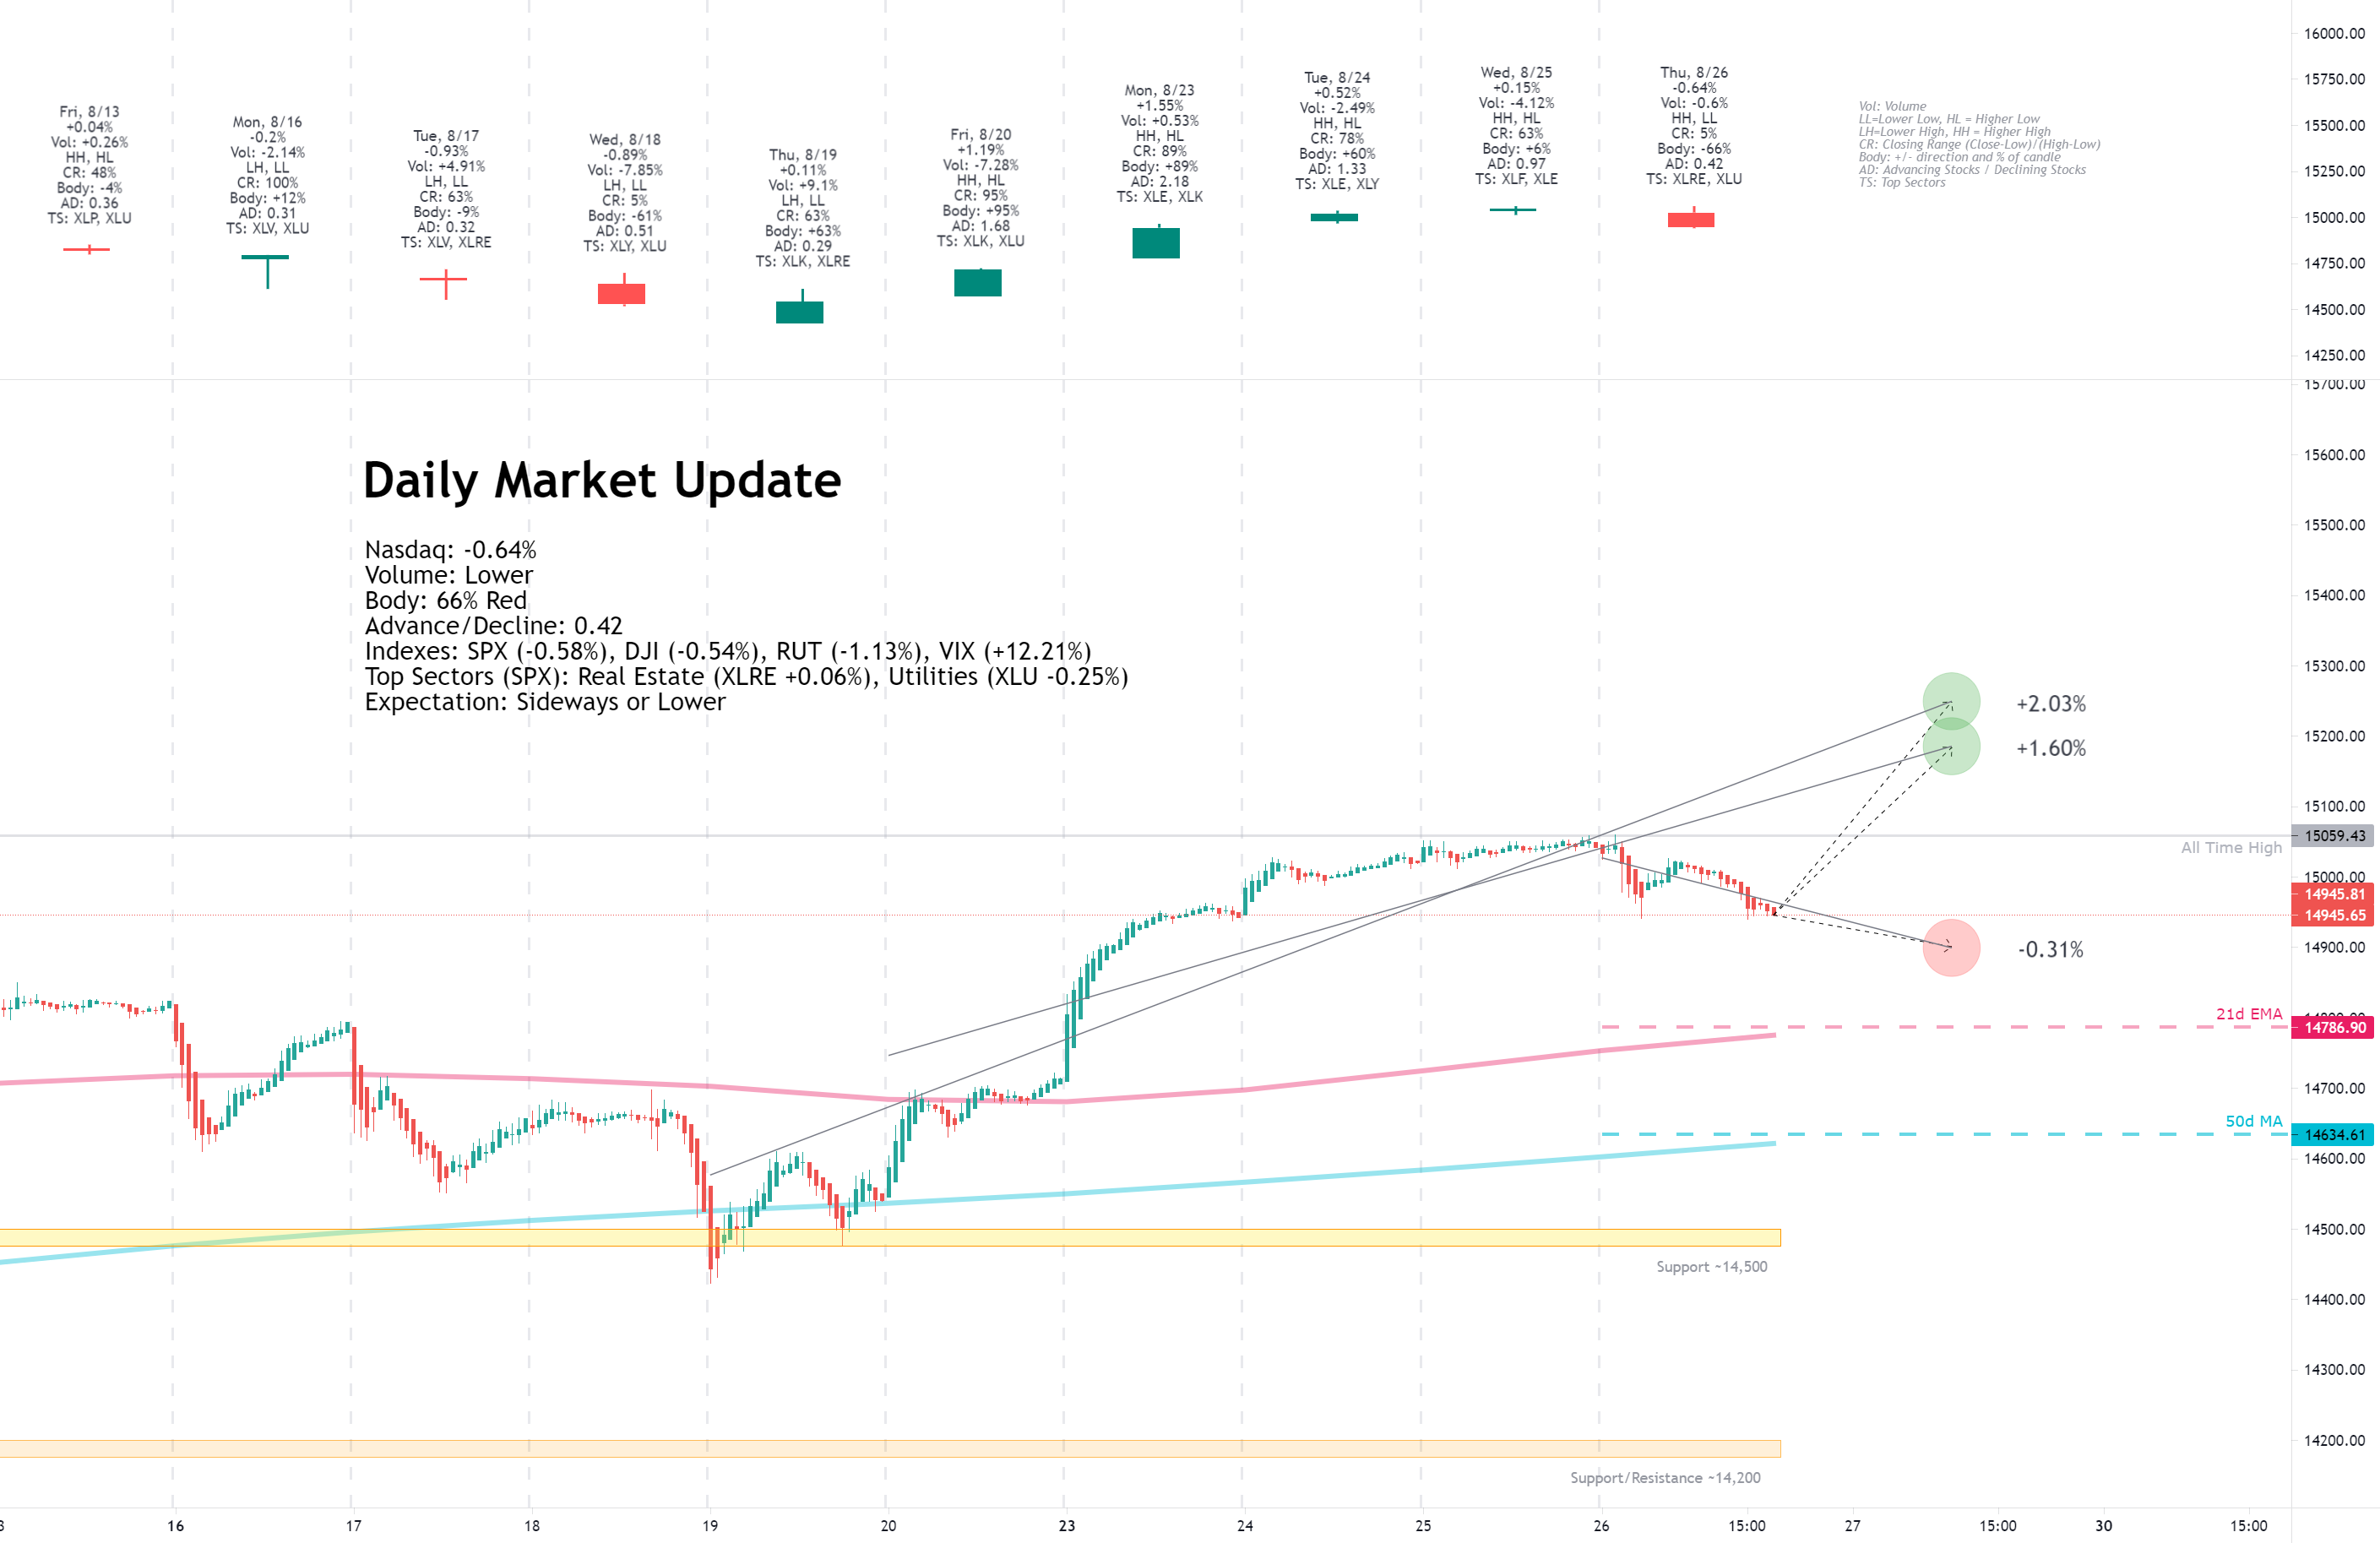
Thursday, August 26, 2021
Facts: -0.64%, Volume lower, Closing Range: 5%, Body: 66% Red
Good: Lower volume
Bad: Closing range, low A/D ratio, lower high/low
Highs/Lows: Lower high, Lower low
Candle: Thick red body at bottom of candle. Longer upper wick than lower wick.
Advance/Decline: 0.42, two declining stocks for every advancing stock
Indexes: SPX (-0.58%), DJI (-0.54%), RUT (-1.13%), VIX (+12.21%)
Sector List: Real Estate (XLRE +0.06%) and Utilities (XLU -0.25%) at the top. Consumer Discretionary (XLY -0.92%) and Energy (XLE -1.52%) at the bottom.
Expectation: Sideways or Lower
Indexes moved lower for the first time in several days as investors became defensive after slightly higher than expected jobless claims data.
The Nasdaq closed with a -0.64% decline on lower volume than the previous day. The red body covers 66% of the candle which has a longer upper wick than lower wick. The closing range of 5% shows the selling continued into close. There were two declining stocks for every advancing stock.
-=x=-=x=-=x=-=x=-=x=-=x=-=x=-
Friday, August 27, 2021
Facts: +1.23%, Volume higher, Closing Range: 92%, Body: 90% Green
Good: All green body, gain on higher volume, higher high/low
Bad: Nothing
Highs/Lows: Higher high, Higher low
Candle: Mostly green body with a short upper wick
Advance/Decline: 2.53, five advancing stocks for every two declining stocks
Indexes: SPX (+0.88%), DJIA (+0.69%), RUT (+2.85%), VIX (-13.00%)
Sector List: Energy (XLE +2.67%) and Communications (XLC +1.58%) at the top. Utilities (XLU -0.03%) and Health (XLV -0.11%) at the bottom.
Expectation: Higher
A dovish stance from the Fed's Jerome Powell at the Jackson Hole Economic Symposium sent stocks higher today. Gains were broadly shared across the market, with small caps leading the way. The S&P 500 and Nasdaq closed at record highs.
The Nasdaq advanced +1.23% for the day. Volume was significantly higher than the previous days. The candle is mostly green body as the index rose throughout the day and only dipped near the close, leaving a short upper wick. The 92% closing range on top of a 90% body is bullish for the index. Gains were broadly shared, with five stocks advancing for every two declining stocks.
-=x=-=x=-=x=-=x=-=x=-=x=-=x=-
View on the Week
Last week's fears melted away to optimism. The Nasdaq rallied to a new all-time high and record weekly close. The S&P 500 marked yet another record close, which has become a common occurrence this year. Yet, the bigger story was with small-caps and the Russell 2000, leading the market higher and building some structural support in the market to continue the rally in the final quarter of the year.
In contrast to last week, when the bad news piled on top of bad news, this week the good news just kept coming. First it was the final FDA approval of the Pfizer vaccine on Monday. Then, it was the approval of the $3.5 trillion budget in the House and a promise of a vote for the Infrastructure bill by the end of September. Economic data was not overly positive, but it also wasn't overly negative. The best news came from the Jackson Hole economic symposium.
At the symposium, the Fed's Jerome Powell gave a speech that perfectly balanced the reality of tapering with a cautiously optimistic outlook toward the economy. Powell acknowledged that there was progress with employment, but still work to do. He also expressed concern over the Delta variant of the Coronavirus. He also restated that inflation appears transitory, and they wouldn't overreact. That showed investors that the Fed would be dovish toward interest rate increases in the near term.
The result of all the good news was a rally throughout the week for the major indexes. Gains were broadly shared across the market. The advance/decline ratio for the Nasdaq was above 1.0 four out of five days in the week. On Friday, the advance/decline ratio for the New York Stock Exchange was 6.58, or more than six advancing stocks for every declining stock.
The Nasdaq advanced +2.82% for the week. Volume was higher than the previous week. The closing range is 96%. The weekly candle has no lower wick and only a tiny upper wick. The only dip during the week was on Thursday.
The Russell 2000 (RUT) led the major indexes with a +5.05% gain for the week. The S&P 500 (SPX) gained +1.52%. The Dow Jones Industrial Average (DJI) rose +0.96%.
The VIX volatility index fell -13.00%.
-=x=-=x=-=x=-=x=-=x=-=x=-=x=-
Sectors
A mix of growth and cyclical sectors topped the list this week. Defensive s all sectors declined for the week after topping the sector list last week.
Energy ( XLE ) held the lead among sectors for the entire week, despite a pullback on Thursday. The sector completely recovered from last week's decline and marked a higher high this week.
All of the cyclical and growth sectors had solid gains, with Financials ( XLF ) ending the week in second place. Technology ( XLK ) trailed the other gaining sectors, underperforming the overall S&P 500 but still finished with a +1.45% gain.
Utilities ( XLU ) was the worst-performing sector for the week as investors rotated out of defensive positions and back into bullish cyclical and growth positions.
-=x=-=x=-=x=-=x=-=x=-=x=-=x=-
Economic Indicators
The US Dollar (DXY) declined -0.83%. The dollar will weaken when investors see a dovish Fed and strengthen when they see a hawkish Fed. A hawkish Fed would raise interest rates, making the US Dollar and Treasuries more attractive. Right now, Jerome Powell is not indicating any move toward raising interest rates as he believes inflation is transitory and raising interest rates would slow down the labor market recovery.
US Treasuries 30y and 10y yields rose for the week while the 2y yield declined. The US 30y-5y spread widened slightly. All Treasury yields dipped on Friday after Jerome Powell's speech. But shorter-term yields dipped more as investors see a slower tapering from the Fed than previously thought.
Both High Yield (HYG) and Investment Grade (LQD) Corporate Bond prices increased for the week.
It was a bullish week for commodities. The highlight was Aluminum that soared back to record highs. The metal is required for in many product packaging other manufacturing processes. High demand for Aluminum means high demand for manufacturing.
All of the commodities were likely impacted by the weakening US Dollar. The moves up for Gold and Silver were mostly from the US Dollar moving down.
Copper and Timber also rose this week, both required for infrastructure.
Crude Oil rebounded from several weeks of declines.
-=x=-=x=-=x=-=x=-=x=-=x=-=x=-
Investor Sentiment
The put/call ratio (PCCE) ended the week at 0.607. It's in the bullish range, but not overly bullish compared to earlier in the week when it hit 0.512.
The CNN Fear & Greed Index moved from Extreme Fear to Neutral.
The NAAIM money manager exposure index moved up to 92.83 this week from 70.57 the previous week.
-=x=-=x=-=x=-=x=-=x=-=x=-=x=-
Stocks of the Week
Amazon (AMZN) moved back above its 40w moving average line with a +4.68% gain. Alphabet (GOOGL) also outperformed, advancing +4.78%. Microsoft (MSFT) pulled back from new all-time highs, declining -1.52% for the week. Apple (AAPL) showed an indecisive week with a +0.28% gain and thin-bodied candle.
Semiconductors (SMH) set a new record close on Friday, advancing +6.11%. The sector was helped higher by Taiwan Semiconductor Manufacturing (TSM) and Nvidia (NVDA) which gained +9.59% and +8.74%, respectively. The two outperformed other mega-caps, topping the list for the week.
Health stocks did not do well this week. Pfizer (PFE) ended the week at the bottom of the mega-cap list with a -4.35% decline, despite getting final FDA approval for its COVID vaccine on Monday. Novo Nordisk (NVO), Eli Lilly (LLY), and Johnson & Johnson (JNJ) were other health-related stocks at the bottom of the mega-cap list.
AMC (AMC) and GameStop (GME) were back in the spotlight this week with huge meme-stock gains on Tuesday. They both pulled back from intra-week highs, but AMC held onto an +18.69% gain for the week, while GameStop held onto a +28.66% advance.
Penn National Gaming (PENN) and DraftKings (DKNG) advanced +23.52% and +15.38% as pro and college football seasons kickoff in the US. ESPN is also reportedly looking to get into the online sports gambling opportunity.
Salesforce.com (CRM), Snowflake (SNOW), and Workday (WDAY) were a few of the earnings winners for the week. Peloton (PTON) had nothing but bad news during its earnings call, announcing a miss on expectations, price drops, and investigations by the DOJ, DHS, and SEC. The stock dropped -8.55% on Friday, ending the week with a -3.45% weekly decline.
-=x=-=x=-=x=-=x=-=x=-=x=-=x=-
Cryptocurrency
Cryptocurrencies have been moving sideways for the past two weeks. Bitcoin (BTCUSD) declined -1.32% this week. Ethereum (ETHUSD) declined -0.69%.
-=x=-=x=-=x=-=x=-=x=-=x=-=x=-
The Week Ahead
Monday
Pending Home Sales data will be available on Monday morning. China will release purchasing manager index data showing current economic activity in the late evening.
Zoom Video (ZM and StoneCo (STNE) will be earnings reports to watch on Monday after the close.
Tuesday
Inflation data for Europe will be available on Tuesday morning. CB Consumer Confidence data will be released after the market opens. API Weekly Crude Oil Stock is updated after the market closes.
Crowdstrike (CRWD), NetEase (NTES), and FUTU Holdings (FUTU) release earnings.
Wednesday
Manufacturing Purchasing Managers Index data will be available on Wednesday. Crude Oil Inventories gets a weekly update after the market opens.
Okta (OKTA), Chewy (CHWY), and Five Below (FIVE) will release earnings on Wednesday.
Thursday
Thursday morning will bring an update to Exports/Imports for July and Initial Jobless Claims for the week.
Broadcom (AVGO), MongoDB (MDB), Hewlett Packard (HPE), Cloudera (CLDR), and Pagerduty (PD) will report earnings.
Friday
Employment data on Friday morning will show the progress in the labor market recovery. It's data watched closely by the Fed to determine economic policy. We'll also get the Non-Manufacturing Purchasing Managers Index.
DocuSign (DOCU) will release earnings on Friday.
-=x=-=x=-=x=-=x=-=x=-=x=-=x=-
The Bullish Side
Two big events this past week provide a bullish outlook for the near term. First, the vote to accept the $3.5 trillion budget proposal in the House and a set deadline for the end of September to vote on the Infrastructure Bill. Second, the clear message from the Fed's Jerome Powell in Jackson Hole reaffirmed that tapering would begin but interest rate changes are still far in the future after more progress is made in recovering the labor market. Inflation is a concern, but the Fed still believes its transitory.
The result was a weaker US dollar and a drop in Treasury yields. Both are bullish for US corporations. To be sure, look at small-caps as the most sensitive segment to changes in economic indicators. The Russell 2000 (RUT) was up +2.85% on Friday and gained 5.05% for the week.
Earning season is winding down and it was overall very positive. Many companies showed strong earnings growth and provided positive guidance for the remainder of the year. High Yield Corporate Bond prices are soaring again as investors are bullish on US businesses. The gap between corporate bond yields and treasury yields is tightening. Corporations have plenty of cash and debt waiting to be spent which they'll unleash to grow their businesses.
-=x=-=x=-=x=-=x=-=x=-=x=-=x=-
The Bearish Side
We may be trending back toward an overly bullish market. Meme stocks were back in play this week with AMC and GME having huge gains. Other new meme stocks started to pop on Friday and may continue into next week. That bullish exuberance can be good for some in the short term but it increases volatility in the market and could weaken sentiment overall.
The Delta variant of COVID is continuing to grow. Daily new cases in the US are higher now than they were one year ago and are approaching levels not seen since before mass vaccination started. It seems the economy and market has grown confident against the possible impact of the continuing pandemic, but that confidence may break at any moment.
-=x=-=x=-=x=-=x=-=x=-=x=-=x=-
Key Nasdaq Levels to Watch
The Nasdaq is back above the 21d EMA and 10d MA, cleared the 15,000 resistance area, and set new all-time highs this week with a record close on Friday.
On the positive side, the levels are:
On the downside, there are a few key levels:
-=x=-=x=-=x=-=x=-=x=-=x=-=x=-
Wrap-up
Several good structural days this week with broadly shared gains looks good for the coming week. Still, with indexes at all-time highs, investors will be watching for any signs of weakness. For now, the bull rally continues and seems we still have momentum to grow from here.
Good luck, stay healthy, and trade safe!
Notes
- The Market Week in Review is my weekend homework where I look over what happened in the previous week and what might come in the next week.
- I occasionally have some errors or typos and will correct them in my blog or the comments on TradingView. I do not have an editor and do this in my free time.
- If you find this helpful, please let me know in the comments. I am also more than happy to add new perspectives and data points if you have ideas.
The structure is the following:
- A recap of the daily updates that I do here on TradingView.
- View on the past week
- What's coming in the next week
- The Bullish View, The Bearish View
- Key index levels to watch out for
- Wrap-up
If you have been following my daily updates, you can skip down to "View on the Week." If not, then this first part is a great play-by-play recap for the week. Click the daily charts for more detail on sectors, indexes, and market leaders each day.
-=x=-=x=-=x=-=x=-=x=-=x=-=x=-
Monday, August 23, 2021
Facts: +1.55%, Volume higher, Closing Range:
91% (w/gap), Body: 89% Green
Good: No lower wick and small upper wick, thick green body with big gain on higher volume
Bad: Nothing
Highs/Lows: Higher high, Higher low
Candle: Gap up at open, thick green body under a small upper wick
Advance/Decline: 2.18, more than two advancing stocks for every declining stock
Indexes: SPX (+0.85%), DJI (+0.61%), RUT (+1.88%), VIX (-7.60%)
Sector List: Energy (XLE +3.75%) and Technology (XLK +1.29%) at the top. Real Estate (XLRE -0.38%) and Utilities (XLU -1.29%) at the bottom.
Expectation: Sideways or Higher
On Monday, the market turned optimistic after the FDA fully approved Pfizer's vaccine, adding a third day of gains off of last week's pivot low and ending with a record for the Nasdaq. Gains were broadly shared across stocks, and the defensive sectors dropped to the bottom of the sector list.
The Nasdaq gained +1.55% for the day and set a new all-time high and record close. Volume was higher than the previous day. The candle has no lower wick for the third straight day. The thick green body covers 89% of the candle and is under a tiny upper wick, resulting in a 91% closing range (including the gap up at open). There were more than two advancing stocks for every declining stock.
-=x=-=x=-=x=-=x=-=x=-=x=-=x=-
Tuesday, August 24, 2021
Facts: +0.52%, Volume lower, Closing Range: 79% (w/gap), Body: 60% Green
Good: Higher high, higher low, fourth day of green candles
Bad: Lower volume, otherwise nothing
Highs/Lows: Higher high, Higher low
Candle: Thinner candle with small upper and lower wicks, mostly green body
Advance/Decline: 1.33, more advancing than declining stocks
Indexes: SPX (+0.15%), DJI (+0.09%), RUT (+1.02%), VIX (+0.41%)
Sector List: Energy (XLE +1.66%) and Consumer Discretionary (XLY +0.71%) at the top. Real Estate (XLRE -0.75%) and Consumer Staples (XLP -0.76%) at the bottom.
Expectation: Sideways or Higher
Small-caps led the markets higher for a another day, giving indexes their fourth day of gains after last week's dip. Even meme stocks were back in play with huge gains from GME and AMC.
The Nasdaq closed +0.52% higher. Volume was lower than the previous day with a short candle that is still mostly body. The 60% body is in between a small upper and lower wick. The index ended the day with a 79% closing range, including the gap. There were more advancing stocks than declining stocks.
-=x=-=x=-=x=-=x=-=x=-=x=-=x=-
Wednesday, August 25, 2021
Facts: +0.15%, Volume lower, Closing Range: 63%, Body: 6% Green
Good: Low volatility day, high A/D ratio, green candle.
Bad: Indecision marked by thin body
Highs/Lows: Higher high, Higher low
Candle: Spinning top candle with thin body in the middle of similar length wicks.
Advance/Decline: 1.14, more advancing than declining stocks
Indexes: SPX (+0.22%), DJIA (+0.11%), RUT (+0.37%), VIX (-2.50%)
Sector List: Financials (XLF +1.18%) and Energy (XLE +0.76%) at the top. Consumer Staples (XLP -0.17%) and Health (XLV -0.27%) at the bottom.
Expectation: Sideways
The Nasdaq and S&P 500 had another set of record closes while the small-cap Russell 2000 continues to outperform as the market heads higher. Economic news was slightly bullish, with core durable goods and crude oil inventories showing more demand than expected.
The Nasdaq closed with a +0.15% gain, just slightly higher than where it opened. Volume was lower than the previous day and remained lower than the 20-day average. The spinning top candle, marked by a thin body in the middle of short upper and lower wicks, shows indecision in the market as the index hits new all-time highs. There were more advancing than declining stocks.
-=x=-=x=-=x=-=x=-=x=-=x=-=x=-
Thursday, August 26, 2021
Facts: -0.64%, Volume lower, Closing Range: 5%, Body: 66% Red
Good: Lower volume
Bad: Closing range, low A/D ratio, lower high/low
Highs/Lows: Lower high, Lower low
Candle: Thick red body at bottom of candle. Longer upper wick than lower wick.
Advance/Decline: 0.42, two declining stocks for every advancing stock
Indexes: SPX (-0.58%), DJI (-0.54%), RUT (-1.13%), VIX (+12.21%)
Sector List: Real Estate (XLRE +0.06%) and Utilities (XLU -0.25%) at the top. Consumer Discretionary (XLY -0.92%) and Energy (XLE -1.52%) at the bottom.
Expectation: Sideways or Lower
Indexes moved lower for the first time in several days as investors became defensive after slightly higher than expected jobless claims data.
The Nasdaq closed with a -0.64% decline on lower volume than the previous day. The red body covers 66% of the candle which has a longer upper wick than lower wick. The closing range of 5% shows the selling continued into close. There were two declining stocks for every advancing stock.
-=x=-=x=-=x=-=x=-=x=-=x=-=x=-
Friday, August 27, 2021
Facts: +1.23%, Volume higher, Closing Range: 92%, Body: 90% Green
Good: All green body, gain on higher volume, higher high/low
Bad: Nothing
Highs/Lows: Higher high, Higher low
Candle: Mostly green body with a short upper wick
Advance/Decline: 2.53, five advancing stocks for every two declining stocks
Indexes: SPX (+0.88%), DJIA (+0.69%), RUT (+2.85%), VIX (-13.00%)
Sector List: Energy (XLE +2.67%) and Communications (XLC +1.58%) at the top. Utilities (XLU -0.03%) and Health (XLV -0.11%) at the bottom.
Expectation: Higher
A dovish stance from the Fed's Jerome Powell at the Jackson Hole Economic Symposium sent stocks higher today. Gains were broadly shared across the market, with small caps leading the way. The S&P 500 and Nasdaq closed at record highs.
The Nasdaq advanced +1.23% for the day. Volume was significantly higher than the previous days. The candle is mostly green body as the index rose throughout the day and only dipped near the close, leaving a short upper wick. The 92% closing range on top of a 90% body is bullish for the index. Gains were broadly shared, with five stocks advancing for every two declining stocks.
-=x=-=x=-=x=-=x=-=x=-=x=-=x=-
View on the Week
Last week's fears melted away to optimism. The Nasdaq rallied to a new all-time high and record weekly close. The S&P 500 marked yet another record close, which has become a common occurrence this year. Yet, the bigger story was with small-caps and the Russell 2000, leading the market higher and building some structural support in the market to continue the rally in the final quarter of the year.
In contrast to last week, when the bad news piled on top of bad news, this week the good news just kept coming. First it was the final FDA approval of the Pfizer vaccine on Monday. Then, it was the approval of the $3.5 trillion budget in the House and a promise of a vote for the Infrastructure bill by the end of September. Economic data was not overly positive, but it also wasn't overly negative. The best news came from the Jackson Hole economic symposium.
At the symposium, the Fed's Jerome Powell gave a speech that perfectly balanced the reality of tapering with a cautiously optimistic outlook toward the economy. Powell acknowledged that there was progress with employment, but still work to do. He also expressed concern over the Delta variant of the Coronavirus. He also restated that inflation appears transitory, and they wouldn't overreact. That showed investors that the Fed would be dovish toward interest rate increases in the near term.
The result of all the good news was a rally throughout the week for the major indexes. Gains were broadly shared across the market. The advance/decline ratio for the Nasdaq was above 1.0 four out of five days in the week. On Friday, the advance/decline ratio for the New York Stock Exchange was 6.58, or more than six advancing stocks for every declining stock.
The Nasdaq advanced +2.82% for the week. Volume was higher than the previous week. The closing range is 96%. The weekly candle has no lower wick and only a tiny upper wick. The only dip during the week was on Thursday.
The Russell 2000 (RUT) led the major indexes with a +5.05% gain for the week. The S&P 500 (SPX) gained +1.52%. The Dow Jones Industrial Average (DJI) rose +0.96%.
The VIX volatility index fell -13.00%.
-=x=-=x=-=x=-=x=-=x=-=x=-=x=-
Sectors
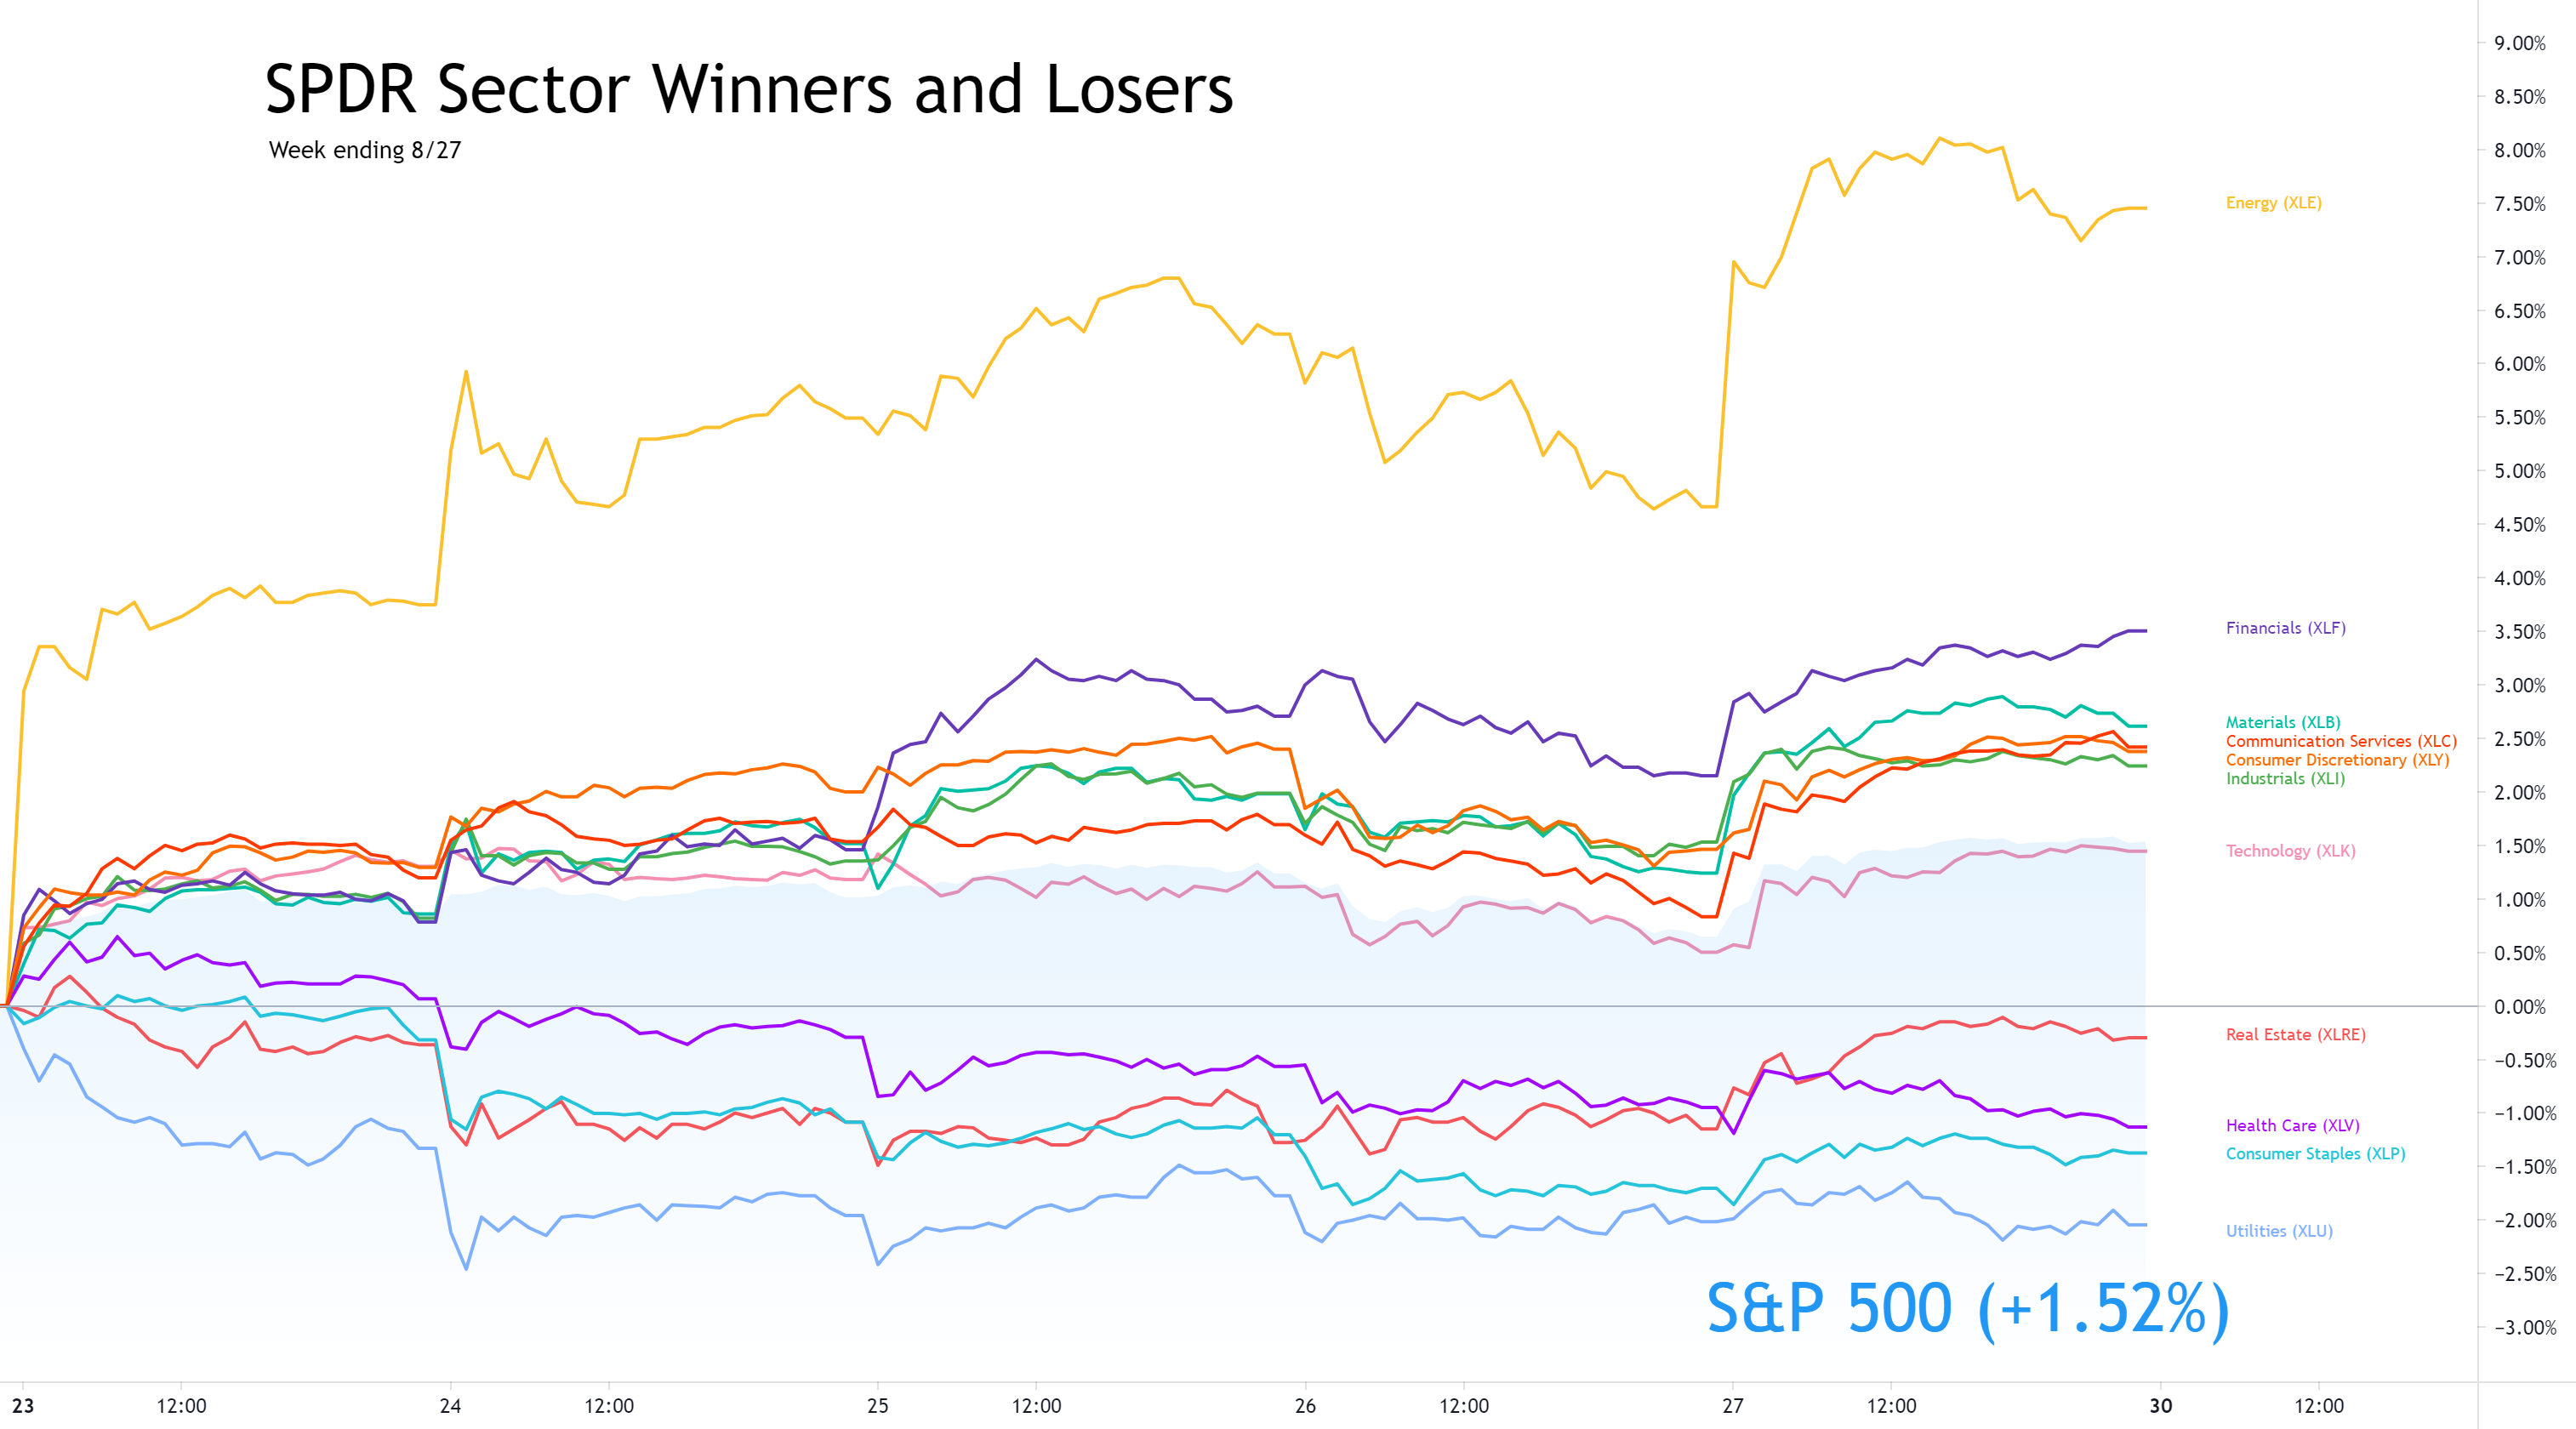
A mix of growth and cyclical sectors topped the list this week. Defensive s all sectors declined for the week after topping the sector list last week.
Energy ( XLE ) held the lead among sectors for the entire week, despite a pullback on Thursday. The sector completely recovered from last week's decline and marked a higher high this week.
All of the cyclical and growth sectors had solid gains, with Financials ( XLF ) ending the week in second place. Technology ( XLK ) trailed the other gaining sectors, underperforming the overall S&P 500 but still finished with a +1.45% gain.
Utilities ( XLU ) was the worst-performing sector for the week as investors rotated out of defensive positions and back into bullish cyclical and growth positions.
-=x=-=x=-=x=-=x=-=x=-=x=-=x=-
Economic Indicators
The US Dollar (DXY) declined -0.83%. The dollar will weaken when investors see a dovish Fed and strengthen when they see a hawkish Fed. A hawkish Fed would raise interest rates, making the US Dollar and Treasuries more attractive. Right now, Jerome Powell is not indicating any move toward raising interest rates as he believes inflation is transitory and raising interest rates would slow down the labor market recovery.
US Treasuries 30y and 10y yields rose for the week while the 2y yield declined. The US 30y-5y spread widened slightly. All Treasury yields dipped on Friday after Jerome Powell's speech. But shorter-term yields dipped more as investors see a slower tapering from the Fed than previously thought.
Both High Yield (HYG) and Investment Grade (LQD) Corporate Bond prices increased for the week.
It was a bullish week for commodities. The highlight was Aluminum that soared back to record highs. The metal is required for in many product packaging other manufacturing processes. High demand for Aluminum means high demand for manufacturing.
All of the commodities were likely impacted by the weakening US Dollar. The moves up for Gold and Silver were mostly from the US Dollar moving down.
Copper and Timber also rose this week, both required for infrastructure.
Crude Oil rebounded from several weeks of declines.
-=x=-=x=-=x=-=x=-=x=-=x=-=x=-
Investor Sentiment
The put/call ratio (PCCE) ended the week at 0.607. It's in the bullish range, but not overly bullish compared to earlier in the week when it hit 0.512.
The CNN Fear & Greed Index moved from Extreme Fear to Neutral.
The NAAIM money manager exposure index moved up to 92.83 this week from 70.57 the previous week.
-=x=-=x=-=x=-=x=-=x=-=x=-=x=-
Stocks of the Week
Amazon (AMZN) moved back above its 40w moving average line with a +4.68% gain. Alphabet (GOOGL) also outperformed, advancing +4.78%. Microsoft (MSFT) pulled back from new all-time highs, declining -1.52% for the week. Apple (AAPL) showed an indecisive week with a +0.28% gain and thin-bodied candle.
Semiconductors (SMH) set a new record close on Friday, advancing +6.11%. The sector was helped higher by Taiwan Semiconductor Manufacturing (TSM) and Nvidia (NVDA) which gained +9.59% and +8.74%, respectively. The two outperformed other mega-caps, topping the list for the week.
Health stocks did not do well this week. Pfizer (PFE) ended the week at the bottom of the mega-cap list with a -4.35% decline, despite getting final FDA approval for its COVID vaccine on Monday. Novo Nordisk (NVO), Eli Lilly (LLY), and Johnson & Johnson (JNJ) were other health-related stocks at the bottom of the mega-cap list.
AMC (AMC) and GameStop (GME) were back in the spotlight this week with huge meme-stock gains on Tuesday. They both pulled back from intra-week highs, but AMC held onto an +18.69% gain for the week, while GameStop held onto a +28.66% advance.
Penn National Gaming (PENN) and DraftKings (DKNG) advanced +23.52% and +15.38% as pro and college football seasons kickoff in the US. ESPN is also reportedly looking to get into the online sports gambling opportunity.
Salesforce.com (CRM), Snowflake (SNOW), and Workday (WDAY) were a few of the earnings winners for the week. Peloton (PTON) had nothing but bad news during its earnings call, announcing a miss on expectations, price drops, and investigations by the DOJ, DHS, and SEC. The stock dropped -8.55% on Friday, ending the week with a -3.45% weekly decline.
-=x=-=x=-=x=-=x=-=x=-=x=-=x=-
Cryptocurrency
Cryptocurrencies have been moving sideways for the past two weeks. Bitcoin (BTCUSD) declined -1.32% this week. Ethereum (ETHUSD) declined -0.69%.
-=x=-=x=-=x=-=x=-=x=-=x=-=x=-
The Week Ahead
Monday
Pending Home Sales data will be available on Monday morning. China will release purchasing manager index data showing current economic activity in the late evening.
Zoom Video (ZM and StoneCo (STNE) will be earnings reports to watch on Monday after the close.
Tuesday
Inflation data for Europe will be available on Tuesday morning. CB Consumer Confidence data will be released after the market opens. API Weekly Crude Oil Stock is updated after the market closes.
Crowdstrike (CRWD), NetEase (NTES), and FUTU Holdings (FUTU) release earnings.
Wednesday
Manufacturing Purchasing Managers Index data will be available on Wednesday. Crude Oil Inventories gets a weekly update after the market opens.
Okta (OKTA), Chewy (CHWY), and Five Below (FIVE) will release earnings on Wednesday.
Thursday
Thursday morning will bring an update to Exports/Imports for July and Initial Jobless Claims for the week.
Broadcom (AVGO), MongoDB (MDB), Hewlett Packard (HPE), Cloudera (CLDR), and Pagerduty (PD) will report earnings.
Friday
Employment data on Friday morning will show the progress in the labor market recovery. It's data watched closely by the Fed to determine economic policy. We'll also get the Non-Manufacturing Purchasing Managers Index.
DocuSign (DOCU) will release earnings on Friday.
-=x=-=x=-=x=-=x=-=x=-=x=-=x=-
The Bullish Side
Two big events this past week provide a bullish outlook for the near term. First, the vote to accept the $3.5 trillion budget proposal in the House and a set deadline for the end of September to vote on the Infrastructure Bill. Second, the clear message from the Fed's Jerome Powell in Jackson Hole reaffirmed that tapering would begin but interest rate changes are still far in the future after more progress is made in recovering the labor market. Inflation is a concern, but the Fed still believes its transitory.
The result was a weaker US dollar and a drop in Treasury yields. Both are bullish for US corporations. To be sure, look at small-caps as the most sensitive segment to changes in economic indicators. The Russell 2000 (RUT) was up +2.85% on Friday and gained 5.05% for the week.
Earning season is winding down and it was overall very positive. Many companies showed strong earnings growth and provided positive guidance for the remainder of the year. High Yield Corporate Bond prices are soaring again as investors are bullish on US businesses. The gap between corporate bond yields and treasury yields is tightening. Corporations have plenty of cash and debt waiting to be spent which they'll unleash to grow their businesses.
-=x=-=x=-=x=-=x=-=x=-=x=-=x=-
The Bearish Side
We may be trending back toward an overly bullish market. Meme stocks were back in play this week with AMC and GME having huge gains. Other new meme stocks started to pop on Friday and may continue into next week. That bullish exuberance can be good for some in the short term but it increases volatility in the market and could weaken sentiment overall.
The Delta variant of COVID is continuing to grow. Daily new cases in the US are higher now than they were one year ago and are approaching levels not seen since before mass vaccination started. It seems the economy and market has grown confident against the possible impact of the continuing pandemic, but that confidence may break at any moment.
-=x=-=x=-=x=-=x=-=x=-=x=-=x=-
Key Nasdaq Levels to Watch
The Nasdaq is back above the 21d EMA and 10d MA, cleared the 15,000 resistance area, and set new all-time highs this week with a record close on Friday.
On the positive side, the levels are:
- The new all-time high was set on Friday and is 15,144.48.
- 15,500 may be the next area of resistance.
On the downside, there are a few key levels:
- 15,000 should became an area of support now.
- The 10d moving average is at 14,831.19.
- The 21d EMA is at 14,818.04.
- The 50d MA is at 14,653.97.
- 14,423.16 is the low of the most recent pullback.
- 14,200 remains a critical level if the index moves downward.
- 14,000 has been an area of support/resistance.
- There is a pivot at 13,903.73.
- A further pullback would likely hit the 200d moving average at 13,616.87. The index hasn't approached this line since rising above it in April 2020.
-=x=-=x=-=x=-=x=-=x=-=x=-=x=-
Wrap-up
Several good structural days this week with broadly shared gains looks good for the coming week. Still, with indexes at all-time highs, investors will be watching for any signs of weakness. For now, the bull rally continues and seems we still have momentum to grow from here.
Good luck, stay healthy, and trade safe!