📈 Ticker:  KHC (The Kraft Heinz Company – NASDAQ)
📆 Timeframe: 1D (Daily)
💵 Current Price: $27.80
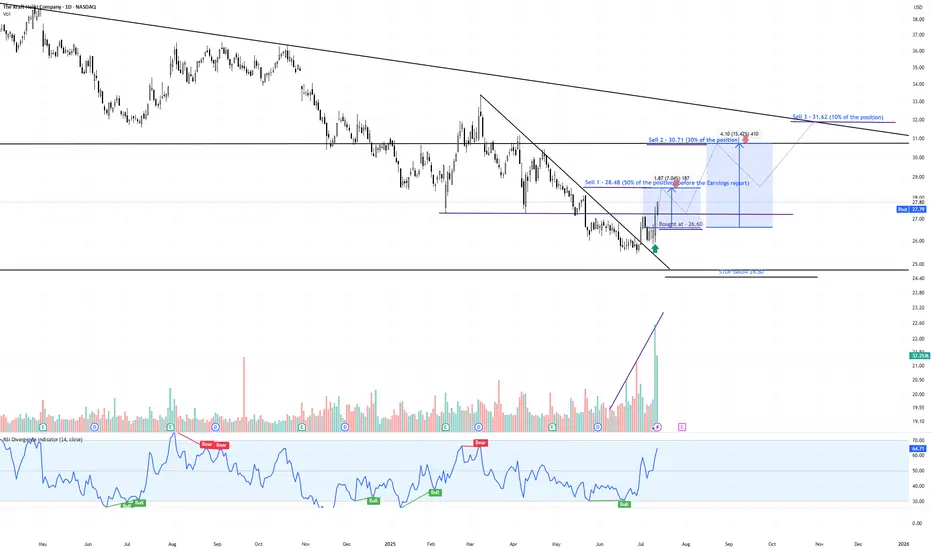
📊 Pattern: Falling Wedge Breakout + Volume & RSI Divergence
📌 Trade Setup:
✅ Our Entry: $26.60
⛔ Stop-Loss: Below $24.80
🔰 Confirmation Signals:
Bullish volume divergence: Selling pressure diminished while price made lower lows
Explosive green volume bar on breakout — strongest in 12+ months
RSI breakout above 60, confirming strong momentum and trend shift
💰 Profit-Taking Strategy:
📍Sell Zone Price Level % of Position Rationale
🥇 Sell 1 $28.48 50% Pre-earnings resistance – lock early profit
🥈 Sell 2 $30.71 30% Next strong resistance area
🥉 Sell 3 $31.62 10% Long-term descending trendline — potential reversal point
🔄 Remaining 10%: Optional trail with stop-loss raised, if momentum continues
📊 Technical Confidence & Probabilities:
🧠 Pattern: Falling Wedge
Bulkowski probability of breakout upward: ~68%
Average gain post-breakout: ~38%, though current targets are more conservative (15–19%)
📈 Volume breakout + prior divergence = strong institutional signal
📉 Risk clearly defined with stop at $24.80
📈 Target Gains vs Entry ($26.60):
🎯 Target Price Gain from Entry
Target 1 $28.48 +7.06%
Target 2 $30.71 +15.47%
Target 3 $31.62 +18.89%
🧾 Summary:
This is a high-probability breakout play, combining:
✅ Bulkowski-validated falling wedge
✅ Volume-based confirmation
✅ Clear stop and tiered exit strategy
✅ Strong risk/reward profile
“Our Entry Price: $26.60 – Breakout Backed by Big Money”
#KHC #TargetTraders #VolumeSpike #BreakoutTrade #TechnicalAnalysis #Bulkowski #StockMarket #Investing
📆 Timeframe: 1D (Daily)
💵 Current Price: $27.80
📊 Pattern: Falling Wedge Breakout + Volume & RSI Divergence
📌 Trade Setup:
✅ Our Entry: $26.60
⛔ Stop-Loss: Below $24.80
🔰 Confirmation Signals:
Bullish volume divergence: Selling pressure diminished while price made lower lows
Explosive green volume bar on breakout — strongest in 12+ months
RSI breakout above 60, confirming strong momentum and trend shift
💰 Profit-Taking Strategy:
📍Sell Zone Price Level % of Position Rationale
🥇 Sell 1 $28.48 50% Pre-earnings resistance – lock early profit
🥈 Sell 2 $30.71 30% Next strong resistance area
🥉 Sell 3 $31.62 10% Long-term descending trendline — potential reversal point
🔄 Remaining 10%: Optional trail with stop-loss raised, if momentum continues
📊 Technical Confidence & Probabilities:
🧠 Pattern: Falling Wedge
Bulkowski probability of breakout upward: ~68%
Average gain post-breakout: ~38%, though current targets are more conservative (15–19%)
📈 Volume breakout + prior divergence = strong institutional signal
📉 Risk clearly defined with stop at $24.80
📈 Target Gains vs Entry ($26.60):
🎯 Target Price Gain from Entry
Target 1 $28.48 +7.06%
Target 2 $30.71 +15.47%
Target 3 $31.62 +18.89%
🧾 Summary:
This is a high-probability breakout play, combining:
✅ Bulkowski-validated falling wedge
✅ Volume-based confirmation
✅ Clear stop and tiered exit strategy
✅ Strong risk/reward profile
“Our Entry Price: $26.60 – Breakout Backed by Big Money”
#KHC #TargetTraders #VolumeSpike #BreakoutTrade #TechnicalAnalysis #Bulkowski #StockMarket #Investing
Pubblicazioni correlate
Declinazione di responsabilità
Le informazioni e le pubblicazioni non sono intese come, e non costituiscono, consulenza o raccomandazioni finanziarie, di investimento, di trading o di altro tipo fornite o approvate da TradingView. Per ulteriori informazioni, consultare i Termini di utilizzo.