KRBL LTD – Falling Wedge Breakout 💥 | Trend Reversal Signal Ahead?
📅 Published on: April 17, 2025
📈 Technical Analysis:
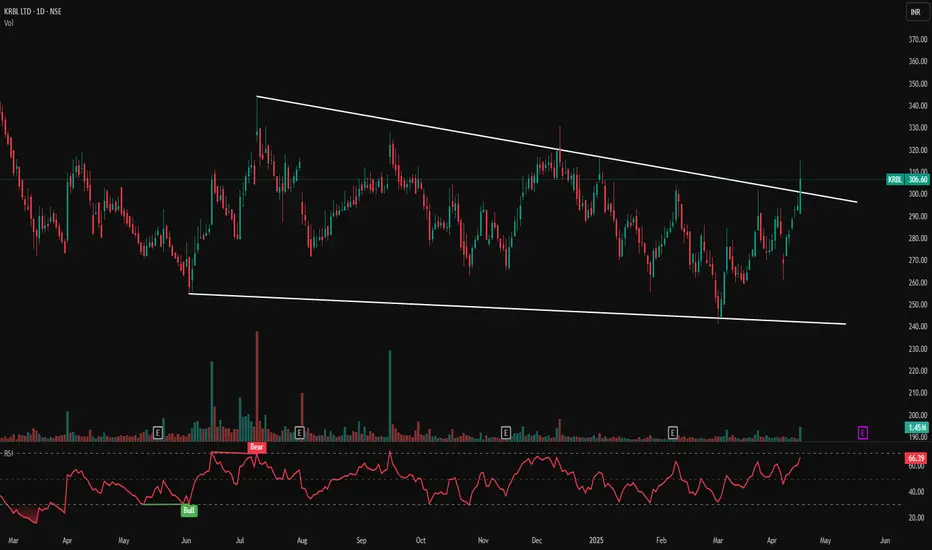
KRBL has shown a bullish breakout from a long-term falling wedge pattern on the daily chart — a classic reversal pattern signalling a potential upward move after prolonged consolidation. The breakout candle is supported by strong volume and a bullish RSI setup.
Pattern: Falling Wedge (Bullish)
Breakout Price: ₹306.60
Previous Resistance Line: Now acting as support
Breakout Volume: 1.45M (above average)
🧭 Key Support & Resistance Levels:
Immediate Support: ₹290
Major Support: ₹275
Immediate Resistance: ₹315
Next Resistance Zone: ₹330 – ₹345
Trendline Resistance (Broken): ₹300 (now support)
🔍 Indicators:
RSI (Relative Strength Index):
Current RSI: 66.39 — bullish, nearing overbought zone, shows strong momentum.
RSI Bullish Crossover observed in April, indicating accumulation before breakout.
🧠 Price Action Observations:
Price respected the wedge formation since March 2024.
A strong bullish candle broke above the upper wedge with conviction.
RSI confirms strength, aligning with price action breakout.
Volume surge supports the breakout's validity.
📌 Strategy (For Educational Purposes):
Entry: ₹305–310 (on retest)
Stop Loss: ₹285 (below wedge support)
Targets:
₹330
₹345
₹360+
📊 Visual Markings & Icons:
White Trendlines: Highlighting falling wedge support and resistance.
Bullish RSI Tags: Marking key bullish RSI crossovers.
Volume Spikes: Notable on breakout day.
Breakout Candle: Large green candle breaching the upper wedge line.
⚠️ Disclaimer:
This analysis is for educational and informational purposes only. Please consult your financial advisor before making any trading decisions.
📅 Published on: April 17, 2025
📈 Technical Analysis:
KRBL has shown a bullish breakout from a long-term falling wedge pattern on the daily chart — a classic reversal pattern signalling a potential upward move after prolonged consolidation. The breakout candle is supported by strong volume and a bullish RSI setup.
Pattern: Falling Wedge (Bullish)
Breakout Price: ₹306.60
Previous Resistance Line: Now acting as support
Breakout Volume: 1.45M (above average)
🧭 Key Support & Resistance Levels:
Immediate Support: ₹290
Major Support: ₹275
Immediate Resistance: ₹315
Next Resistance Zone: ₹330 – ₹345
Trendline Resistance (Broken): ₹300 (now support)
🔍 Indicators:
RSI (Relative Strength Index):
Current RSI: 66.39 — bullish, nearing overbought zone, shows strong momentum.
RSI Bullish Crossover observed in April, indicating accumulation before breakout.
🧠 Price Action Observations:
Price respected the wedge formation since March 2024.
A strong bullish candle broke above the upper wedge with conviction.
RSI confirms strength, aligning with price action breakout.
Volume surge supports the breakout's validity.
📌 Strategy (For Educational Purposes):
Entry: ₹305–310 (on retest)
Stop Loss: ₹285 (below wedge support)
Targets:
₹330
₹345
₹360+
📊 Visual Markings & Icons:
White Trendlines: Highlighting falling wedge support and resistance.
Bullish RSI Tags: Marking key bullish RSI crossovers.
Volume Spikes: Notable on breakout day.
Breakout Candle: Large green candle breaching the upper wedge line.
⚠️ Disclaimer:
This analysis is for educational and informational purposes only. Please consult your financial advisor before making any trading decisions.
Trade chiuso: obiettivo raggiunto
The first resistance level has been touched. If the trend is to continue, it's important to follow a trailing stop-loss strategy and patiently wait for the price to approach the second resistance level.Declinazione di responsabilità
Le informazioni ed i contenuti pubblicati non costituiscono in alcun modo una sollecitazione ad investire o ad operare nei mercati finanziari. Non sono inoltre fornite o supportate da TradingView. Maggiori dettagli nelle Condizioni d'uso.
Declinazione di responsabilità
Le informazioni ed i contenuti pubblicati non costituiscono in alcun modo una sollecitazione ad investire o ad operare nei mercati finanziari. Non sono inoltre fornite o supportate da TradingView. Maggiori dettagli nelle Condizioni d'uso.