Hello, fellow traders!
Follow us to get the latest information quickly.
Have a great day.
-------------------------------------
Chainlink is one of the coins connected to many ecosystems.
Therefore, I believe it's worth holding for the medium to long term.
(LINKUSDT 1M chart)
The key is whether the price can find support around 23.98-25.17 and rise along the uptrend line.
If not, caution is advised as it may touch the lower uptrend line.
-
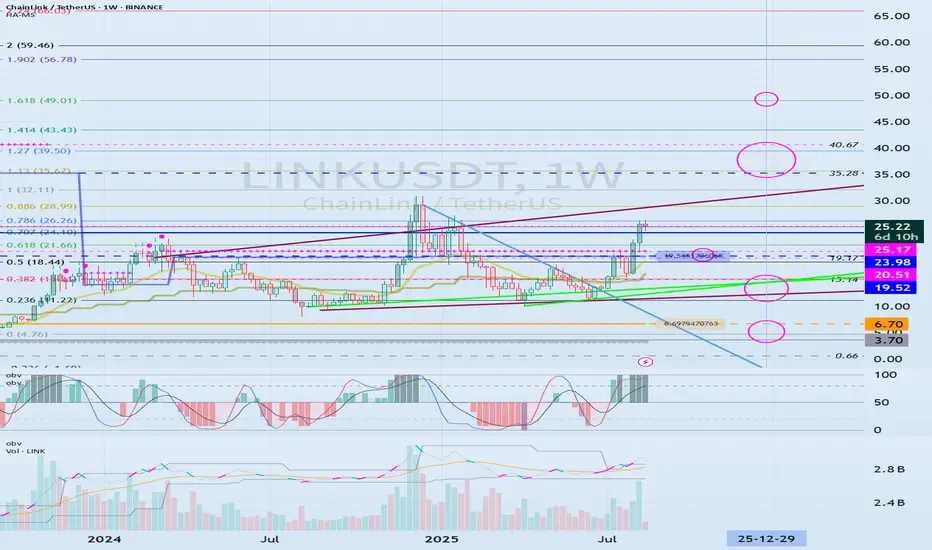
(1W chart)
If the price finds support around 23.98-25.17 and rises,
1st: 35.28-40.67
2nd: Fibonacci ratio 1.618 (49.01)
It is expected to rise to the 1st and 2nd levels above.
After that, a bearish turn appears likely.
Based on the current price, if it falls below the 19.52-20.51 range, it is recommended to stop trading and wait and see how the situation develops.
-
(1D chart)
Ultimately, the key is whether the price can break above the uptrend line (1).
If not, you should check for support within the circled area marked on the chart.
However, if the price falls below the M-Signal indicator on the 1M chart, you should stop trading and wait and see how things turn out.
-
Thank you for reading.
I wish you successful trading.
--------------------------------------------------
- This is an explanation of the big picture.
(3-year bull market, 1-year bear market pattern)

I will explain in more detail when the bear market begins.
------------------------------------------------------
※ Follow X to check out the posts.
※ X를 팔로우하고 게시물을 확인하세요.
◆ t.me/readCryptoChannel
[HA-MS Indicator]
bit.ly/3YxHgvN
[OBV Indicator]
bit.ly/4dcyny3
※ X를 팔로우하고 게시물을 확인하세요.
◆ t.me/readCryptoChannel
[HA-MS Indicator]
bit.ly/3YxHgvN
[OBV Indicator]
bit.ly/4dcyny3
Pubblicazioni correlate
Declinazione di responsabilità
Le informazioni e le pubblicazioni non sono intese come, e non costituiscono, consulenza o raccomandazioni finanziarie, di investimento, di trading o di altro tipo fornite o approvate da TradingView. Per ulteriori informazioni, consultare i Termini di utilizzo.