Lululemon (LULU) — Deep Value Setup with Technical Reversal Signals
Summary:
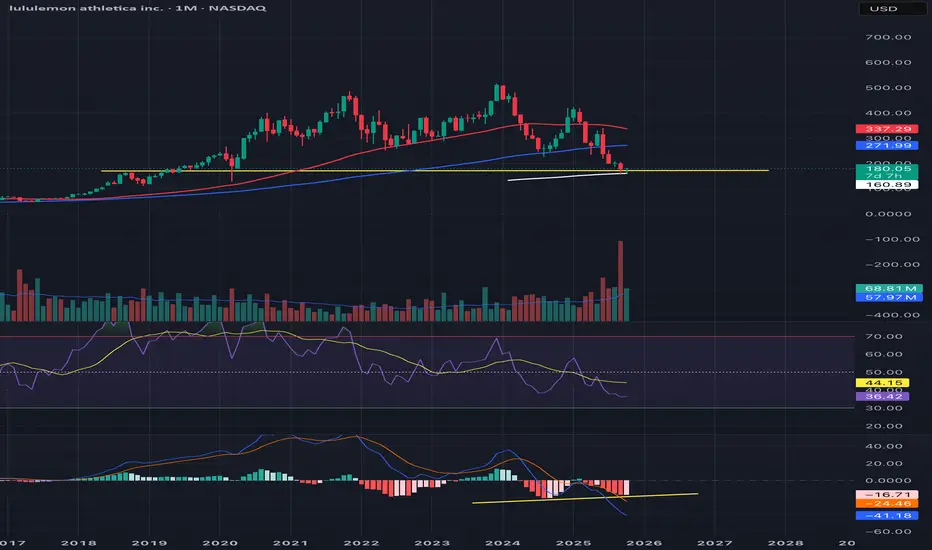
Lululemon (LULU) has seen substantial downside over the past several months, declining nearly 58% since early February. Despite the steep correction, multiple technical and fundamental indicators suggest the stock may be approaching a major inflection point.
Technical Outlook:
Price action has now reached a key long-term support zone, as illustrated by the yellow trendline on the chart. Additionally, a bullish divergence has formed on the MACD, a historically reliable signal of momentum reversal when paired with strong support levels.
Fundamental Perspective:
While the company revised its 2025 guidance lower, the underlying fundamentals remain strong. According to Morningstar’s fair value estimate, LULU’s intrinsic value is approximately $295 per share, implying the stock currently trades at a ~64% discount to its assessed business value.
Investment Thesis:
With nearly 3 decades of operational excellence, a loyal customer base, and a proven global brand, Lululemon is unlikely to face long-term solvency or relevance risk. This setup aligns best with long-term investors who are comfortable holding positions through near-term volatility to capitalize on potential multi-year upside.
Timeframe: Monthly (long-term investment horizon)
Summary:
Lululemon (LULU) has seen substantial downside over the past several months, declining nearly 58% since early February. Despite the steep correction, multiple technical and fundamental indicators suggest the stock may be approaching a major inflection point.
Technical Outlook:
Price action has now reached a key long-term support zone, as illustrated by the yellow trendline on the chart. Additionally, a bullish divergence has formed on the MACD, a historically reliable signal of momentum reversal when paired with strong support levels.
Fundamental Perspective:
While the company revised its 2025 guidance lower, the underlying fundamentals remain strong. According to Morningstar’s fair value estimate, LULU’s intrinsic value is approximately $295 per share, implying the stock currently trades at a ~64% discount to its assessed business value.
Investment Thesis:
With nearly 3 decades of operational excellence, a loyal customer base, and a proven global brand, Lululemon is unlikely to face long-term solvency or relevance risk. This setup aligns best with long-term investors who are comfortable holding positions through near-term volatility to capitalize on potential multi-year upside.
Timeframe: Monthly (long-term investment horizon)
Declinazione di responsabilità
Le informazioni ed i contenuti pubblicati non costituiscono in alcun modo una sollecitazione ad investire o ad operare nei mercati finanziari. Non sono inoltre fornite o supportate da TradingView. Maggiori dettagli nelle Condizioni d'uso.
Declinazione di responsabilità
Le informazioni ed i contenuti pubblicati non costituiscono in alcun modo una sollecitazione ad investire o ad operare nei mercati finanziari. Non sono inoltre fornite o supportate da TradingView. Maggiori dettagli nelle Condizioni d'uso.