Hello everyone
Let's take a look at the LUNA / USDT chart on the 1D interval.
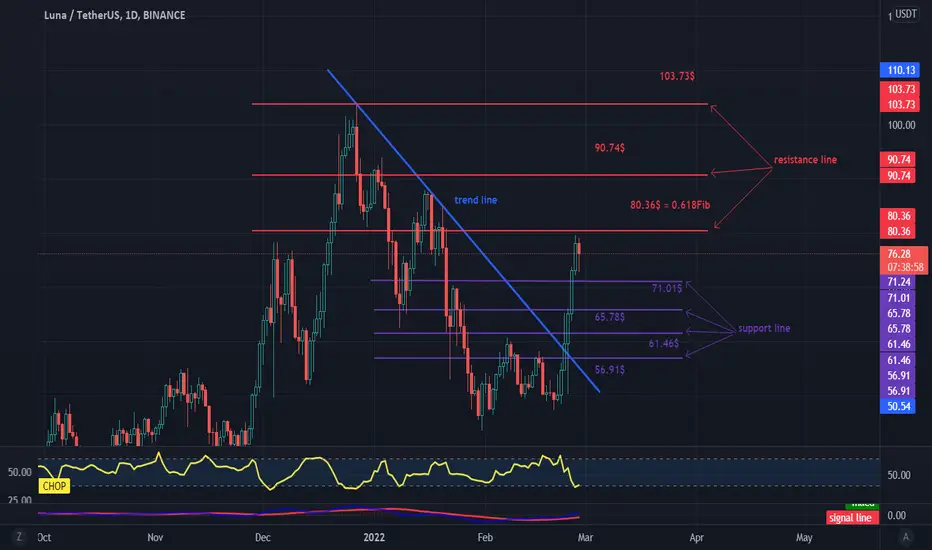
Let's start with determining the downtrend line which, as you can see, managed to break and the valuation shot up.
It is worth appointing a new support that has formed at the price of $ 71.01 and another one at $ 65.78, $ 61.46, $ 56.91.
Now let's move on to determining the resistance that the price has to overcome, we see that the first resistance is at $ 80.36 = 0.618Fib, the so-called golden point from which the price has rebounded once, another moama resistance at $ 90.74 and $ 103.73.
We will look at the CHOP and MACD indicators. The first indicates that we are slowly regaining our energy and the second is a continuation of the upward trend.
Let's take a look at the LUNA / USDT chart on the 1D interval.
Let's start with determining the downtrend line which, as you can see, managed to break and the valuation shot up.
It is worth appointing a new support that has formed at the price of $ 71.01 and another one at $ 65.78, $ 61.46, $ 56.91.
Now let's move on to determining the resistance that the price has to overcome, we see that the first resistance is at $ 80.36 = 0.618Fib, the so-called golden point from which the price has rebounded once, another moama resistance at $ 90.74 and $ 103.73.
We will look at the CHOP and MACD indicators. The first indicates that we are slowly regaining our energy and the second is a continuation of the upward trend.
Declinazione di responsabilità
Le informazioni ed i contenuti pubblicati non costituiscono in alcun modo una sollecitazione ad investire o ad operare nei mercati finanziari. Non sono inoltre fornite o supportate da TradingView. Maggiori dettagli nelle Condizioni d'uso.
Declinazione di responsabilità
Le informazioni ed i contenuti pubblicati non costituiscono in alcun modo una sollecitazione ad investire o ad operare nei mercati finanziari. Non sono inoltre fornite o supportate da TradingView. Maggiori dettagli nelle Condizioni d'uso.