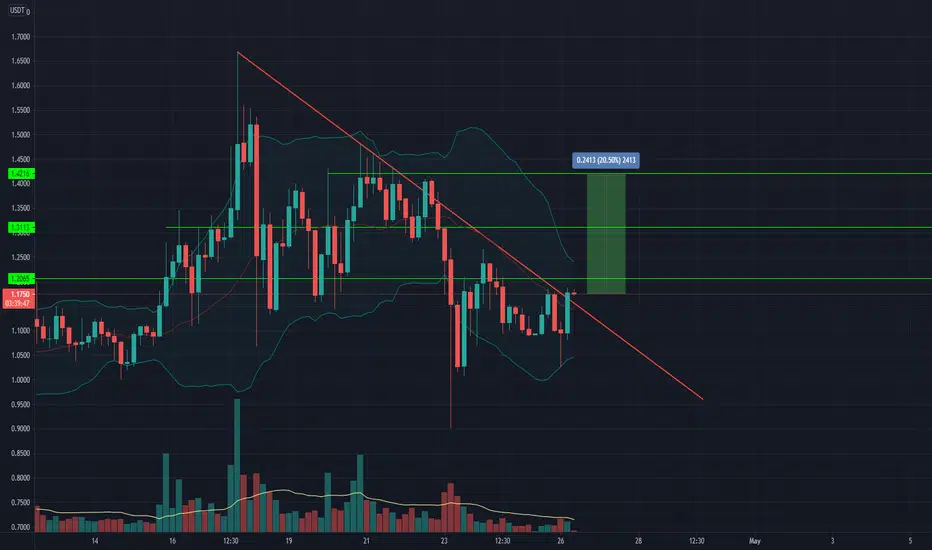
As you can see in the chart, the 4-hour time frame, Mana was able to break its downward trend line after several attempts. (In the previous candlestick, the price closed above the downtrend line).
With the closing of the current 4-hour candle, we can hope that the price will grow up to the specified green resistance levels.
Because in addition to the above, the Bollinger Bands indicator is also interesting:
- Price has tried several times to break the simple moving average in the middle, which finally succeeded in the previous candle with a big and good servant.
Declinazione di responsabilità
Le informazioni ed i contenuti pubblicati non costituiscono in alcun modo una sollecitazione ad investire o ad operare nei mercati finanziari. Non sono inoltre fornite o supportate da TradingView. Maggiori dettagli nelle Condizioni d'uso.
Declinazione di responsabilità
Le informazioni ed i contenuti pubblicati non costituiscono in alcun modo una sollecitazione ad investire o ad operare nei mercati finanziari. Non sono inoltre fornite o supportate da TradingView. Maggiori dettagli nelle Condizioni d'uso.